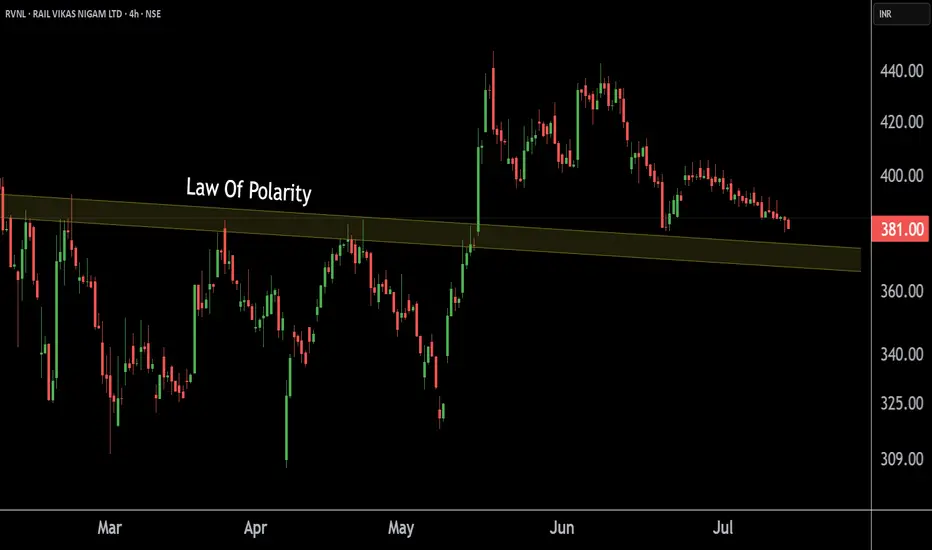
Rail Vikas Nigam's Key Level ! RVNL respecting its Support levelThis is the 4 hour timeframe chart of Rail Vikas Nigam Ltd.
RVNL having a Good law of polarity near at 365-370 level.
If this level is sustain ,then we may see higher prices in RVNL.
Thank You.
RVNL trade ideas
RVNLRVNL
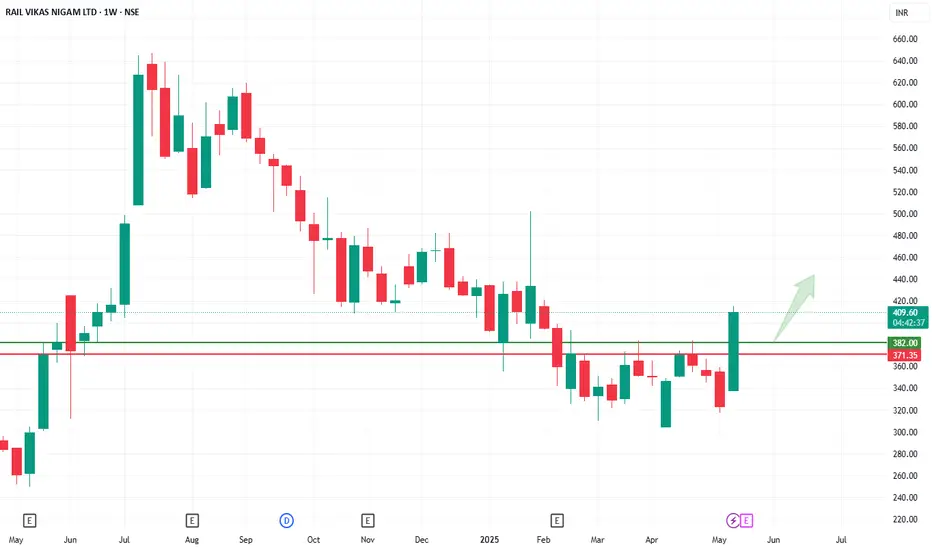
watch above levels. green line is our entry, redline is our SL.
DISCLAIMER : I am NOT a SEBI registered advisor or a financial adviser. All the views are for educational purpose only.
Rail Vikas Nigam Ltd view for Intraday 16th May #RVNL Rail Vikas Nigam Ltd view for Intraday 16th May #RVNL
Resistance 380 Watching above 380 for upside momentum.
Support area 370 Below 375 ignoring upside momentum for intraday
Watching below 369 for downside movement...
Above 375 ignoring downside move for intraday
Charts for Educational purposes only.
Please follow strict stop loss and risk reward if you follow the level.
Thanks,
V Trade Point

Long Term - Railway Fundamental PickRailway stocks are currently trading near their 52-week low because of the market decline. Here are some solid fundamental picks to consider adding to your portfolio for the long term.
📊 Script: RVNL
⏱️ C.M.P 📑- 335
🎯 PE 🏆 - 56.1
📊 Script: RAILTEL
⏱️ C.M.P 📑- 281
🎯 PE 🏆 - 32.4
📊 Script: IRCON
⏱️ C.M.P 📑- 144
🎯 PE 🏆 - 17.7
📊 Script: IRFC
⏱️ C.M.P 📑- 122
🎯 PE 🏆 - 24.5
📊 Script: TITAGARH
⏱️ C.M.P 📑- 748
🎯 PE 🏆 - 34.6
⚠️ Important: Always maintain your Risk & Reward Ratio.
✅Like and follow to never miss a new idea!✅
Disclaimer: I am not SEBI Registered Advisor. My posts are purely for training and educational purposes.
Eat🍜 Sleep😴 TradingView📈 Repeat 🔁
Happy learning with trading. Cheers!🥂

RVNL AnalysisIt is in down trend and likely chance it will touch 290, I have used Gann techniques, trend, & waves.

RVNLRVNL, fine the levels on chart. green line is our entry point and red line is our SL.
DISCLAIMER : I am NOT a SEBI registered advisor or a financial adviser. All the views are for educational purpose only.

Rvnl ready to blastTrend line conformation conform
Market also convert to bullish
Buy now walt for atleast 2 months to give good profit
Iam not SEBI register
Iam sharing based on trendline


Rail Vikas Nik Ltd view for Intraday 4th Dec #RVNL Rail Vikas Nik Ltd view for Intraday 4th Dec #RVNL
Resistance 450. Watching above 451 for upside movement...
Support area 430 Below 445 ignoring upside momentum for intraday
Support 430 Watching below 429 for downside movement...
Resistance area 450
Above 435 ignoring downside move for intraday
Charts for Educational purposes only.
Please follow strict stop loss and risk reward if you follow the level.
Thanks,
V Trade Point

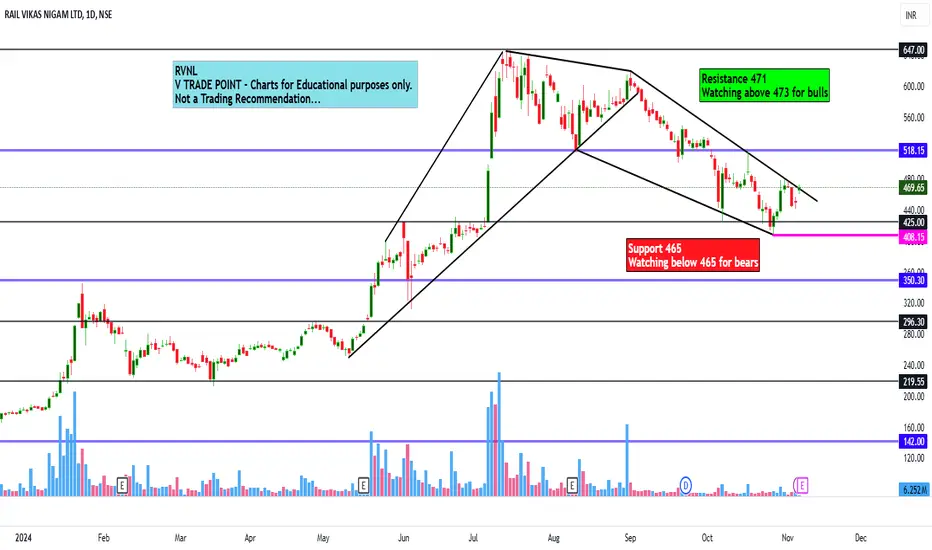
Rail Vikas Nigam Ltd view for Intraday 7th Nov #RVNL Rail Vikas Nigam Ltd view for Intraday 7th Nov #RVNL
Resistance 470-471. Watching above 473 for upside movement...
Support area 465. Below 465 ignoring upside momentum for intraday
Support 465 .Watching below 465 for downside movement...
Resistance area 470
Above 470 ignoring downside move for intraday
Charts for Educational purposes only.
Please follow strict stop loss and risk reward if you follow the level.
Thanks,
V Trade Point3
Rail Vikas Nigam Ltd for Intraday 31st October #RVNL ResistancRail Vikas Nigam Ltd for Intraday 31st October #RVNL
Resistance 470. Watching above 471for upside movement...
Support area 460. Below 455 ignoring upside momentum for intraday
Support 460.Watching below 459 for downside movement...
Resistance area 470
Above 456 ignoring downside move for intraday
Charts for Educational purposes only.
Please follow strict stop loss and risk reward if you follow the level.
Thanks,
V Trade Point

RVNL - 15 Min Chart - Good for SwingLooking for a up move for a swing trade. CMP.474.20 -Retest done

RVNL Swing Idea on Daily timeframeRVNL after a long bull run and giving high of 647.00 is now moving in range and creating a descending triangle. My view is that it will continue to move in a range following the trend line from upside. One can go for a buy trade around 530 with a target around 580. Stop loss can be a closing below 510 or 500.


RAIL VIKAS NIGAM LTD - RVNLRVNL -
Daily TF shows a breakout with good volumes. Also a Flag and Pole breakout. RSI above 60.
Good RR for entry around CMP. Safer entry will be above ATH so around 650 levels Strict SL of 545 on closing basis. Target will be Flag Height giving a good RR.
Standard disclaimer :
I am not a REGISTERED SEBI Analyst.
I am not responsible for anyone's losses or gains. These ideas are for my own studies

RVNL symmetrical triangle break out in progressWith great ADX and sub par volumes, RVNL is consolidating in a symmetrical triangle as the breakout failed last time around!
With strong volumes and continuation of momentum, it can break out of the triangle and move towards 580-590 with momentum, it can hit 777 very quick in just one or two quarters. The only lagging factor being that the revenue generation from the first high speed rail project may start in mid 2026 as per some reports, which may start momentum in the stock!
Recently RVNL has tied up with a Malaysian company to execute projects in ASEAN for rail manufacturing and operation in ASEAN region! This is a big boost and can only accelerate post the commencement of the first leg of Ahmedabad Mumbai high speed rail corridor as a proof of concept!

Focus on Rvnl this stock is ready for breakout.rvnl stock is stay is breakout zone focus this stock .This stock is breakout level 600.
buy ----600 cross
sl-------548
1st tgt- 700
2nd tgt--730
This stock follow only weekly buy and injoy profit.

#RVNL BEST TIME TO SWINGAs we can clearly see a strong bull flag
Pattan and a strong brake out
First it ready to cross 0.5 golden ratio
And above 100 Ema
If the stock cross the 0.5 golden ratio it can give 30 % return in the week

RVNL will be sky rocket soon. The quarterly results are not good for RVNL as compared to previous quarter. Chart looks bearish at the moment. I will wait for the 480 levels for the buy. This is published just for a study purpose. Please take a positions as per your risk.


RVNLLooks good on Chart.
Breakout possible.
Long Consolidation done.
Above all EMA.
Good for Short term.
Do Like ,Comment , Follow for regular Updates...
Keep Learning ,Keep Earning...
Disclaimer : This is not a Buy or Sell recommendation. I am not SEBI Registered. Please consult your financial advisor before making any investments . This is for Educational purpose only.

RVNL ascending triangle breakout setup in progressRVNL had a long channel for years and channel breakout resulted in TGT of 580. It had a couple of consolidation and now had a short term TGT of 650-660. Once it breaks the ascending triangle Breakout at around 650-660. It has a potential TGT of around 743.

RVNL S/R for 12/7/24Support and Resistance Levels: In technical analysis, support and resistance levels are significant price levels where buying or selling interest tends to be strong. They are identified based on previous price levels where the price has shown a tendency to reverse or find support.
Support levels are represented by the green line and green shade, indicating areas where buying interest may emerge to prevent further price decline.
Resistance levels are represented by the red line and red shade, indicating areas where selling pressure may arise to prevent further price increases. Traders often consider these levels as potential buying or selling opportunities.
Breakouts: Breakouts occur when the price convincingly moves above a resistance level (red shade) or below a support level (green shade). A bullish breakout above resistance suggests the potential for further price increases, while a bearish breakout below support suggests the potential for further price declines. Traders pay attention to these breakout signals as they may indicate the start of a new trend or significant price movement.
20 EMA: The yellow line denotes 20 EMA, to interpret the 20 EMA, you need to compare it with the prevailing stock price. If the stock price is below the 20 EMA, it signals a possible downtrend. But if the stock price is above the 20 EMA, it signals a possible uptrend.
Disclosure: I am not SEBI registered. The information provided here is for learning purposes only and should not be interpreted as financial advice. It is important to consult with a qualified financial advisor before making any investment decisions. Tweets neither advice nor endorsement.
