Salzer electSalzer is making a harmonic pattern, inmediate resistance 1585. Once sustsins tht cn reach to point D. Keep eye.
SALZERELEC trade ideas

SALZER ELECTRONICS LTD S/RSupport and Resistance Levels:
Support Levels: These are price points (green line/shade) where a downward trend may be halted due to a concentration of buying interest. Imagine them as a safety net where buyers step in, preventing further decline.
Resistance Levels: Conversely, resistance levels (red line/shade) are where upward trends might stall due to increased selling interest. They act like a ceiling where sellers come in to push prices down.
Breakouts:
Bullish Breakout: When the price moves above resistance, it often indicates strong buying interest and the potential for a continued uptrend. Traders may view this as a signal to buy or hold.
Bearish Breakout: When the price falls below support, it can signal strong selling interest and the potential for a continued downtrend. Traders might see this as a cue to sell or avoid buying.
MA Ribbon (EMA 20, EMA 50, EMA 100, EMA 200) :
Above EMA: If the stock price is above the EMA, it suggests a potential uptrend or bullish momentum.
Below EMA: If the stock price is below the EMA, it indicates a potential downtrend or bearish momentum.
Trendline: A trendline is a straight line drawn on a chart to represent the general direction of a data point set.
Uptrend Line: Drawn by connecting the lows in an upward trend. Indicates that the price is moving higher over time. Acts as a support level, where prices tend to bounce upward.
Downtrend Line: Drawn by connecting the highs in a downward trend. Indicates that the price is moving lower over time. It acts as a resistance level, where prices tend to drop.
Disclaimer:
I am not a SEBI registered. The information provided here is for learning purposes only and should not be interpreted as financial advice. Consider the broader market context and consult with a qualified financial advisor before making investment decisions.

SALZER ELEC - BULLISHSuper movement in channel... Promoters have increased stake continuously... Entering EV business... For long term...
Disclaimer: invested from lower levels.... Not a recommendation... Only educational purposes

SlazerelecSLAZERELEC
CMP 1115
Near breakout zone
Second time trying to break resistance
Volume spurt

#SALZERELEC#SALZERELEC
SALZERELEC Good for Holding around 6 TO 9 Months ..... Current Price at 848.05......... Keep SL at 802. .... (On Closing Basis ... Means ... Daily Candle closed Below 802 )….. After Close Crossing 913 …. Trail SL to 913 Targets are Shown on Chart in Greens .
Patent
It has received a patent for ‘Integral Cam Operated Rotary Switches’ for a duration of 20 years, ending 2031. It has registered a Patent for Rotary Switches, five product patents in process.
Diversification into Smart Meter
In Feb,24, the company announced the establishment of a Smart Meter Manufacturing Business in Coimbatore with an annual production capacity of 4 million smart energy meters which will be increased to 10 million in Phase Two. The first batch of smart meters is expected to roll out in Q1 FY25.
Clientele
Valeo, Delta, Siemens, L&T, Schneider Electric, Nuclear Power Corporation, Kone, Indian Railways CED, ABB etc
Market Share
The Co is the largest manufacturer of Cam Operated Rotary Switches with 25% market share.
Promoter holding has increased by 2.08% over last quarter.


Resistance BreakoutPlease look into the chart for a detailed understanding.
Consider these for short-term & swing trades with 2% profit.
For BTST trades consider booking
target for 1% - 2%
For long-term trades look out for resistance drawn above closing.
Please consider these ideas for educational purpose

IH&S pattern formation done on Salzer Electronics scripThere has been a breakout on Salzer electronics after IH&S formation on charts with great volumes supporting the breakout

Salzer Electronics Ltd - 23.03.2023Salzer Electronics Ltd - 23.03.2023
The Prices are below EMA in weekly chart
The immediate resistance zone is 261
one can initiate a long position at current levels (253.50) with support @ 239 for further upside price movements.
stochastic is ticking up in weekly charts
watch out for the price action

Salazer Electronics: breakout candidateSalazer electronics is a potential candidate for strong breakout. Keep it on your radar!!!!

#SALZERELEC #NIFTY #BANKNIFTY #MUHURATTRADING #MUHURAT #RELIANCESalzer Electronics Ltd.
NSE:SALZERELEC
NSE:SALZERELEC
CMP: 180.55
Target 1: 210
Time frame: <2months
Factors:
BULLISH WEDGE BREAKOUT
Trend Following
Rising Volume with rising Prices.
Flag pattern breakout.
Pennant Pattern Breakout with Bullish Candle.
Retest Successful.
Higher Highs & Higher Lows.
Broken above RESISTANCE levels
Trading at SUPPORT levels
Earnings are strong.
Bullish Wedge Breakout
Risk Return Ratio is healthy.
And
Rising from Double Bottom Pattern to Flag Pattern forming.
If you like my work KINDLY LIKE SHARE & FOLLOW this page for free Stock Recommendations.
With 💚 from Rachit Sethia

SALZER ELECTRONICS DAILY CHART Break out retested , a great stock to play manufacturing and EV theme , tgt 188-190

Broken Trend line
Stock Analysis: Salzer electronics small cap stock broken trend line with good volume also seems it has formed HNS pattern currently trading on supply zone(Red Area) , crossing above supply zone around 150 expected to reach the target given on the chart unless it is not crossing below demand zone.
Happy Investing!

Salzer Electronics: Time to watch: IndiaBy Sun Storm Investment Research
A Profit & Solutions Strategy

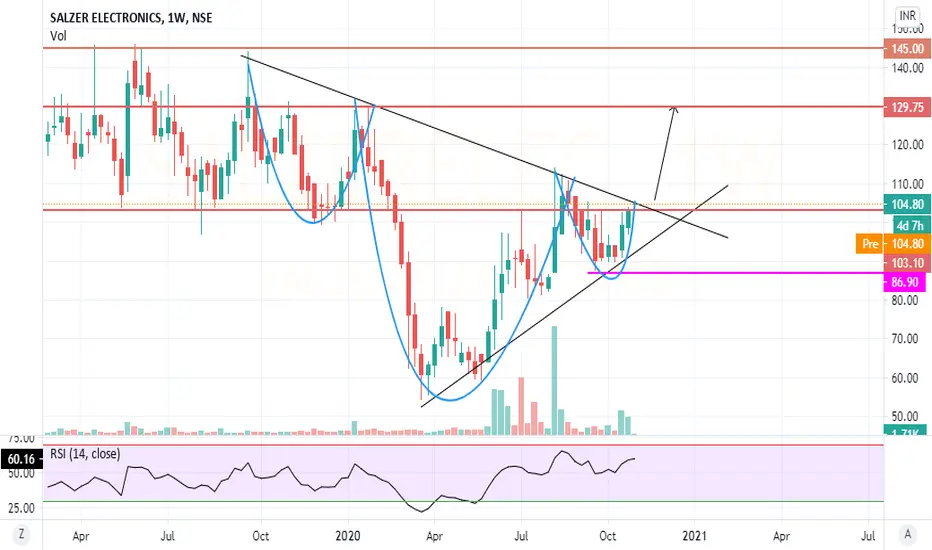
salzer electronics _educational studyin forming of c & h pattern after it will close on 129/130 week basis, please share your view.