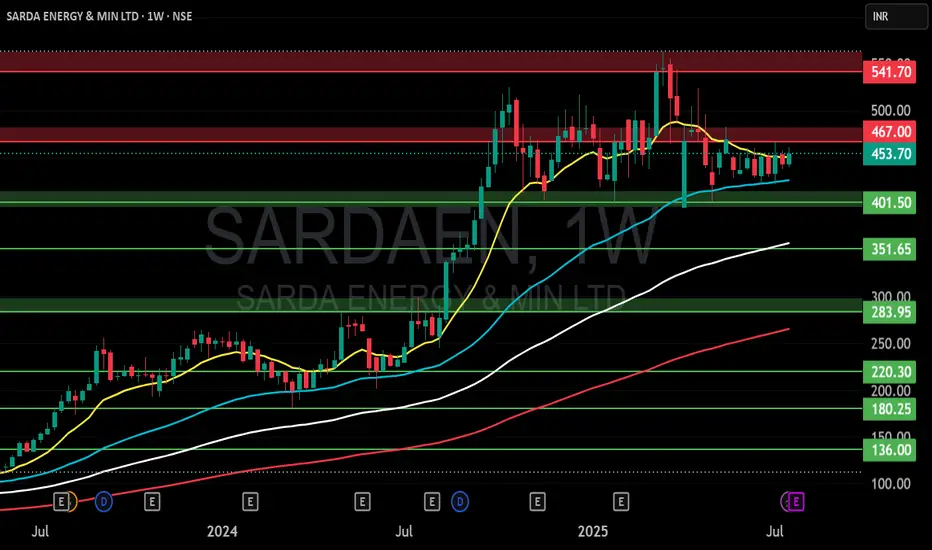
SARDA ENERGY & MIN LTD S/RSupport and Resistance Levels:
Support Levels: These are price points (green line/shade) where a downward trend may be halted due to a concentration of buying interest. Imagine them as a safety net where buyers step in, preventing further decline.
Resistance Levels: Conversely, resistance levels (red line/shade) are where upward trends might stall due to increased selling interest. They act like a ceiling where sellers come in to push prices down.
Breakouts:
Bullish Breakout: When the price moves above resistance, it often indicates strong buying interest and the potential for a continued uptrend. Traders may view this as a signal to buy or hold.
Bearish Breakout: When the price falls below support, it can signal strong selling interest and the potential for a continued downtrend. Traders might see this as a cue to sell or avoid buying.
MA Ribbon (EMA 20, EMA 50, EMA 100, EMA 200) :
Above EMA: If the stock price is above the EMA, it suggests a potential uptrend or bullish momentum.
Below EMA: If the stock price is below the EMA, it indicates a potential downtrend or bearish momentum.
Trendline: A trendline is a straight line drawn on a chart to represent the general direction of a data point set.
Uptrend Line: Drawn by connecting the lows in an upward trend. Indicates that the price is moving higher over time. Acts as a support level, where prices tend to bounce upward.
Downtrend Line: Drawn by connecting the highs in a downward trend. Indicates that the price is moving lower over time. It acts as a resistance level, where prices tend to drop.
Disclaimer:
I am not a SEBI registered. The information provided here is for learning purposes only and should not be interpreted as financial advice. Consider the broader market context and consult with a qualified financial advisor before making investment decisions.
SARDAEN trade ideas
SARDEAN1) Breakout with huge volume
2) retested support level
3) nifty 50 corrected but stock consolidates
a) SL 483
b) using supertrend 7, 2.5 on daily timeframe for trailing SL & target.

Sarda Energy & MineralsSarda Energy & Minerals looks like consolidating after the breakout. It has formed a tight flag. If it closes above 565 then it would be considered as a breakout. Weak below 525. This post is purely for educational purposes to learn the financial markets.
Disclaimer: I'm not a SEBI registered advisor. This is a paper trade idea for educational purposes. Not to be performed in their real accounts. Always consult your financial advisor before taking trading and investment decisions. You are liable for your profits and losses, and nobody will be held responsible.


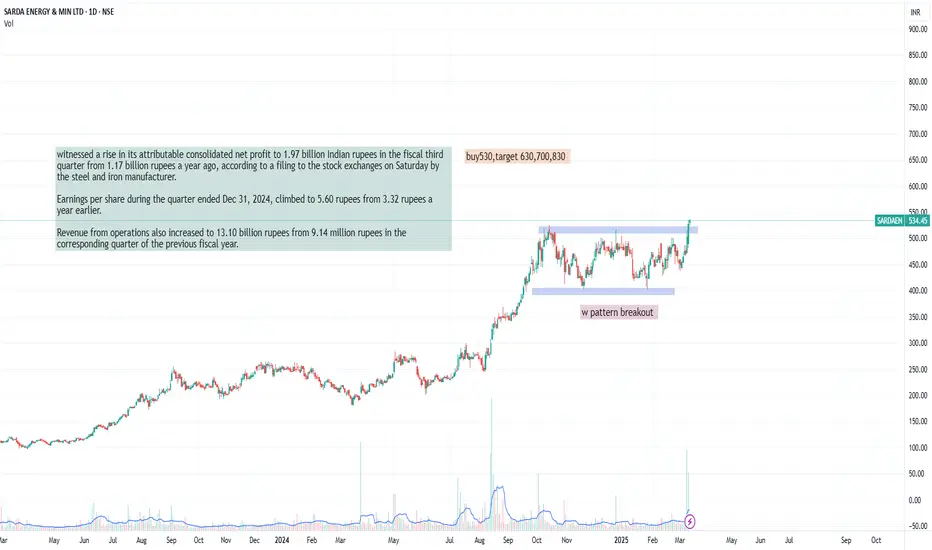
sarda energywitnessed a rise in its attributable consolidated net profit to 1.97 billion Indian rupees in the fiscal third quarter from 1.17 billion rupees a year ago, according to a filing to the stock exchanges on Saturday by the steel and iron manufacturer.
Earnings per share during the quarter ended Dec 31, 2024, climbed to 5.60 rupees from 3.32 rupees a year earlier.
Revenue from operations also increased to 13.10 billion rupees from 9.14 million rupees in the corresponding quarter of the previous fiscal year.
Sarda Energy Sarda Energy is in range , signaling a potential breakout as its in a bullish pattern. One can look above 515 fr a new high.

SARDA ENERGY & MIN LTD ⚡ SARDA ENERGY & MIN LTD (NSE) - Breakout Watch! ⚡
📈 Symmetrical Triangle Pattern tightening—breakout loading?
🔍 Stock testing resistance near 52WH
✅ RS Rating: 97.7 | Alpha Signal: BUY
📊 Strong accumulation, momentum building!
Is this ready for a breakout move? Let’s discuss! 👇🔥
#Breakout #StockMarket #SARDA #Trading #Investing

50 SMA Rising- Positional TradeDisclaimer: I am not a Sebi registered adviser.
This Idea is publish purely for educational purpose only before investing in any stocks please take advise from your financial adviser.
Its 50 SMA Rising Strategy. Suitable for Positional Trading Initial Stop loss lowest of last 2 candles and keep trailing with 50 days SMA if price close below 50 SMA then Exit or be in the trade some time trade can go for several months.
Be Discipline because discipline is the Key to Success in the STOCK Market.
Trade What you see not what you Think

Ascending triangle breakoutGood volume buildup in daily and weekly timeframe.
Highest volume buildup in past one year.
Ascending triangle breakout with good volume.
Depending on the market momentum the price cand give small retracement or move up.
Fundamental's are OK.
DII stakes are up.
NOTE: I do my analysis, do yours before trade.

SARDAEN - Sarda Energy & Minerals- Strong Bullish Momentum (Buy)Technical Analysis of SARDAEN - Sarda Energy & Minerals (SARDAEN):- Here's a breakdown of the technical analysis for SARDAEN:
Personal Opinion:- As per my technical analysis, I am Bullish in this stock and you can buy SARDAEN stock at CMP@274-290 or wait for a dip to enter in the buy trade. This stock is beneficial to buy short to long term point of view.
Overall Trend:
Positive - As per previous chart and current chart pattern along with my technical analysis based on indicaotrs shows a one-week and one-month strong buy technical rating for SARDAEN.
Upward trajectory - The stock price has increased by 15% in the last week, 22% over the month, and a whopping 75% over the past year.
Technical Analysis Based on Indicators:
Relative Strength Index (RSI): The overall oscillator rating leans towards buy. This suggests the stock might not be overbought yet.
Moving Average Convergence Divergence (MACD): The technical ratings suggest a bullish trend with the help of MACD analysis.
Other factors to consider:-
Volatility:- SARDAEN has a moderate volatility of 12.43%
Beta:- 0.86, indicating a slightly lower volatility than the overall market
Earnings Report:- The next earnings report is due on July 29, 2024. Positive earnings reports can lead to price increases.
Important Disclaimer:-
Technical analysis is a helpful tool, but it shouldn't be the sole factor in your investment decisions. Consider fundamental analysis (company financials, industry outlook, etc.) and your overall risk tolerance before making any trades.
Remember, this is just a starting point. Do your own research before making any investment decisions as I am not SEBI registered person to suggest any stock
Thanks for your support as always


SARDAENwe are looking SARDAEN in bullish move.
Disclaimer:
Kind regards to all friends and members ,
Stock market investment is subject to 100% market risks. Our company is not a SEBI registered company. Please consult your financial advisor before investing. This is for learning and training purposes only. Market Traps administrators are not responsible for any financial gains or losses resulting from your decisions. You acknowledge that stock market investments are highly risky and that you understand the market risks involved. Hence any legal action is void.

#SARDAENProduct Portfolio
The Co. offers a wide range of products that include Wires Rods, HB Wires, Ferro Alloys, Pellets, Sponge Iron, and Billets.
Ongoing Capex Projects
Minerals: 1 Gare Palma IV/7 Coal Mine Chhattisgarh: Capacity enhanced from 1.2 MTPA to 1.44 MTPA in May-23, and increasing further to 1.68 MTPA in FY24 and seeking approvals for enhancement to 5.2 MTPA which will be carried out in phases. Also, setting up dedicated Railway Siding for more efficient coal transportation.
2 Coal Washery: Capacity expansion from 0.96 MTPA to 1.8 MTPA is under process.
3 Shahpur West Coal Mine : Extractable reserves of 13.4 MT and Production capacity of 0.6 MTPA – EC, CTE and Stage 1 Forest clearance received.
4 Surjagad 1 unexplored Iron Ore Block in Maharashtra: Declared as Preferred Bidder with 126.35% revenue share in May-23.
Energy
1 Hydro Power: 24.9 MW plant on the Rehar river in Chhattisgarh - construction has started; Expected to achieve CoD in FY25.
2 Solar Power: 50 MW plant to be installed at Chhattisgarh facility for captive consumption, replacing costly grid power; Contract awarded
Steel :
1 Wire Rod Mill: Received consent for capacity expansion from 180,000 MT to 250,000 MT, in FY23.
2 Iron Ore Pellet Plant: Received consent for capacity expansion from 8,00,000 tonnes p.a to 9,00,000 tonnes p.a., on 22-Dec-23.
Waste :
1 Setting up a new project for manufacturing Mineral Fibre with an estimated outlay of Rs. 70 Crores. The project is expected to be
operational by FY25.

NSE:SARDAEN about to burp
Market Cap ₹ 8,746 Cr.
Current Price ₹ 249
High / Low ₹ 265 / 96.7
Stock P/E 15.7
Book Value ₹ 104
Dividend Yield 0.30 %
ROCE 19.3 %
ROE 18.7 %
Face Value ₹ 1.00

Long Above 258Long can inititate once stock close above the 258, with Stop loss of 245 for the targes of 300-320-340.

Energy Breakout trading implementation:
1. **Identifying New Trends:** Breakout trading helps traders identify the beginning of new trends by focusing on price levels where an asset breaks out of its historical trading range.
2. **Volatility Indicator:** Breakouts often occur when there's increased volatility in the market. Monitoring breakouts can provide insights into shifts in market sentiment and potential price movements.
3. **Entry Points:** Breakout points serve as potential entry points for traders looking to ride the momentum of a newly established trend. Buying on a breakout can capture the early stages of a price movement.
4. **Confirmation of Strength:** Successful breakouts indicate the strength of a trend. If an asset breaks out with high volume and follows through with sustained price movement, it suggests a strong trend in that direction.
5. **Avoiding False Signals:** Breakout strategies often include using indicators or confirmation signals to avoid false breakouts. This can enhance the accuracy of trade decisions.
6. **Defined Risk and Reward:** Breakout trading allows for setting clear stop-loss levels below the breakout point, which helps manage risk. Traders can also calculate potential profits based on the distance between the breakout point and a projected target.
7. **Adaptable to Various Markets:** Breakout trading can be applied to various markets, including stocks, forex, commodities, and cryptocurrencies. The concept remains consistent across different assets.
8. **Flexibility:** Traders can adapt breakout strategies to their preferred timeframes, whether they are day traders, swing traders, or long-term investors.
9. **Liquidity Opportunities:** Breakout points are often associated with increased trading volume, which can provide better liquidity for executing trades.
10. **Risk vs. Reward Assessment:** Traders can evaluate the potential risk of a trade (stop-loss) against the potential reward (target price), aiding in decision-making and portfolio management.
11. **Psychological Advantage:** Successful breakout trades can boost a trader's confidence and discipline, reinforcing the effectiveness of their strategy.
12. **Market Events:** Breakouts can occur around significant market events such as earnings reports, economic data releases, or geopolitical developments, offering traders opportunities to capitalize on sudden price movements.
Remember, while breakout trading offers potential advantages, it also carries risks. False breakouts and market reversals can lead to losses. Successful implementation requires a solid understanding of technical analysis, risk management, and the ability to adapt to changing market conditions.

Sarda energy approaching breakoutKeep and eye on SARDAEN,
Looks good setting up on resistance zone.
Wait for clean breakout.
Personally entered at 1345, will add more if breakout happens.

trend line work support and resistance finally breakout 1) weak chart analysis
2) chart following trend line from 2011 to 2023
3) Trend lines work as support and resistance.
4) December 2009 and July 2011 trend lines work as support
5) 2011 February to July may time work as support and finally break down.
6) this same trend line worked as resistance in august 2014, January 2018 and April 2022
7) August 2014: breakout of this resistance trend line but no sustained upside.
8) Finally, break down bottom level 7 (resistance at 35 and fall down from 40)
9) From bottom level 7 to resistance level 63, it takes 2 years (771% return).
10) from resistance comes down at 9 level
11) may 2022 attempt for break level but not possible that time
12) now this line is breaking out and moving new life time high
13) take 200 as stop loss and get 300-350 first target
no recommendation for buy and sell

Upflag breakout in daily frameUpflag breakout
Target - 260
SL - 185 / or if sma 5 does a negative crossover with sma 13
buying price - 200
RR ratio - 1:4
Duration - 1 week
Disclaimer - This is only for educational purposes

Sarda Energy and Minerals-Nice breakoutSarda Energy and Minerals-Nice breakout.
Capital to be deployed- 20k
Price -1414
Stoploss-1223
Targets-2024/2577
#sardaenergy #nifty50 #NiftyBank #investment #StockMarket #StocksToBuy

SARDAEN - Weekly AnalysisIn the Weekly Chart of SARDAEN ,
we can see that, it is near Cup & handle breakout.
plan you enter as per your RISK and SL

SARDAENNote: Educational purpose only
trendline Breakout
Swing trade opportunity
Capacity expansion in Ferro Alloys plant also commissioned recently

Buy : Sarda EnergyIf Volume activity picks up above the high of this box, we can soon see NEW HIGHS in this stock.
