Next report date
—
Report period
—
EPS estimate
—
Revenue estimate
—
10.60 INR
2.04 B INR
11.71 B INR
57.62 M
About SAREGAMA INDIA LTD
Sector
Industry
CEO
Vikram Mehra
Website
Headquarters
Mumbai
Founded
1902
ISIN
INE979A01025
FIGI
BBG000BZXBB6
Saregama India Ltd. is a holding company, which engages in the manufacture and sale of music storage device. It operates through the following segments: Music; and Film, TV Serials, and Events. The Music segment includes the manufacture and sale of music storage device, such as carvaan, mini carvaan, music card, audio compact discs, and digital versatile discs. The Film, TV Serials, and Events segment consists of production, and sale, telecast, broadcast of films, TV Serials, pre-recorded programmes; organizing live musical events, and dealing in film rights. The company was founded in 1902 and is headquartered in Mumbai, India.
Related stocks
Coming out of VCP tightness with decent volumesI am posting after a long time but nevertheless, here we go.
#Saregama is looking really nice as it is coming out of this recent tightness after multiple contractions on the daily chart.
When you put the volume, you could see that there is a decent contraction and finally a breakout with good vo


Breaking out - Cup n Handle formationSaregama
Double Digit ROE and ROCE
PEG Ration ~ 2
Promoter's stake increased
FII stake increased
DII stake increased
Stable EPS
Technical: After a Bull run the stock went into consolidation and now breaking out on Weekly time frame with large volumes.
Note: Only an analysis not a buy/sell recomme

SAREGAMANSE:SAREGAMA
WAIT FOR WEEKLY CLOSE OF CANDLE
One Can Enter Now !
Or Wait for Retest of the Trendline (BO) !
Or wait For better R:R ratio !
Note :
1.One Can Go long with a Strict SL below the Trendline or Swing Low.
2. R:R ratio should be 1 :2 minimum
3. Plan as per your RISK appetite and Mon

SAREGAMA:NSE ATH+RBC 3Y-8M BO on DTF/WTF/MTF PositionalSAREGAMA Analysis WTF
TRADE PLAN
ENTRY -580-590
SL -550 DTF CLOSE
TARGET -01-817
Hold For a Year or TGT
Chart Pattern :
SAREGAMA has a clear 3Y-8M RBC&H completed
STOCK has recently broken its ATH of 581 forming a 3Y-8M RBC&H on the DTF/WTF/MTF. Pullback to form a Handle completed.
INDICAT


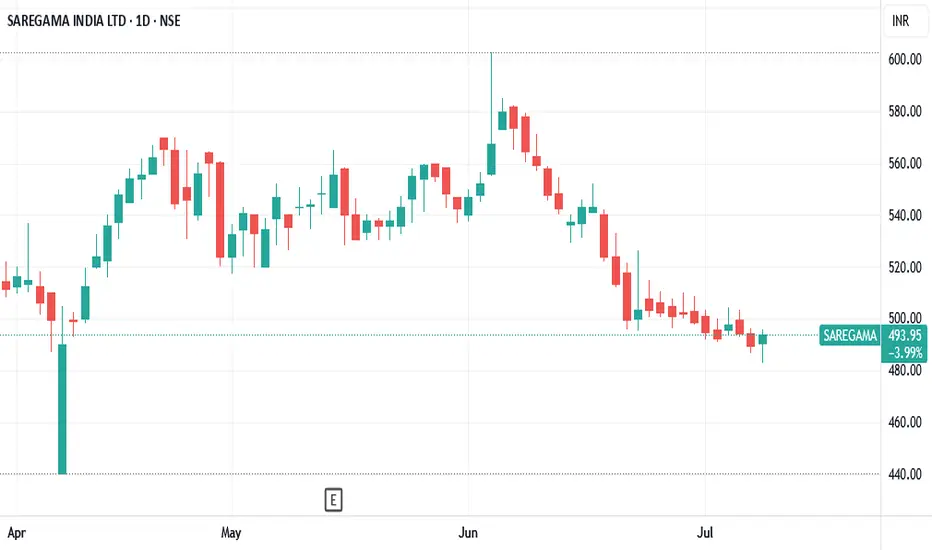
ATH breakout retestGood volume buildup in daily timeframe with good volume.
Breakout retest of ATH successfully.
Fundamentals are good.
FII & DII stakes are up.
NOTE: I do my analysis, do yours before trade.
Eat🍜 Sleep😴 TradingView📈 Repeat 🔁

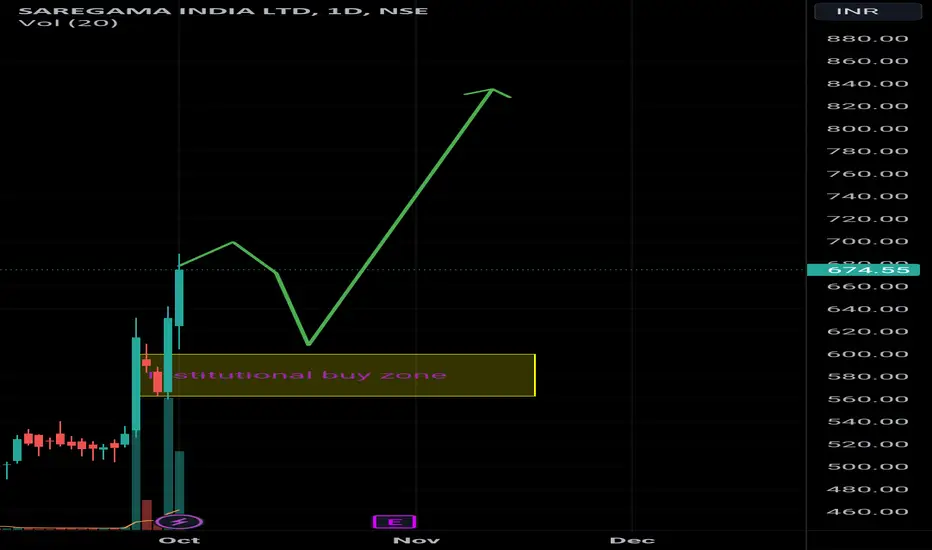
Institutional buy zone on SaregamaThere is Institutional zone visible near 615 area. If it comes closer to 615, which is expected, it is expected to bounce back and reach levels of 800.
Entered SAREGAMA @600 Sl 500 TRADE: Have Entered SAREGAMA@600 SL 500 with Half Risk
REASON TO TRADE: Post 3 years of consolidation it has broken out of the range and now seems geared up for the demand in its shares.
DEFINED SL@500 on Daily Closing Basis.

See all ideas
Summarizing what the indicators are suggesting.
Neutral
SellBuy
Strong sellStrong buy
Strong sellSellNeutralBuyStrong buy
Neutral
SellBuy
Strong sellStrong buy
Strong sellSellNeutralBuyStrong buy
Neutral
SellBuy
Strong sellStrong buy
Strong sellSellNeutralBuyStrong buy
An aggregate view of professional's ratings.
Neutral
SellBuy
Strong sellStrong buy
Strong sellSellNeutralBuyStrong buy
Neutral
SellBuy
Strong sellStrong buy
Strong sellSellNeutralBuyStrong buy
Neutral
SellBuy
Strong sellStrong buy
Strong sellSellNeutralBuyStrong buy
Displays a symbol's price movements over previous years to identify recurring trends.
Frequently Asked Questions
The current price of SAREGAMA is 485.65 INR — it has decreased by −1.72% in the past 24 hours. Watch SAREGAMA INDIA LTD stock price performance more closely on the chart.
Depending on the exchange, the stock ticker may vary. For instance, on NSE exchange SAREGAMA INDIA LTD stocks are traded under the ticker SAREGAMA.
SAREGAMA stock has fallen by −1.08% compared to the previous week, the month change is a −4.07% fall, over the last year SAREGAMA INDIA LTD has showed a −10.15% decrease.
We've gathered analysts' opinions on SAREGAMA INDIA LTD future price: according to them, SAREGAMA price has a max estimate of 691.00 INR and a min estimate of 538.00 INR. Watch SAREGAMA chart and read a more detailed SAREGAMA INDIA LTD stock forecast: see what analysts think of SAREGAMA INDIA LTD and suggest that you do with its stocks.
SAREGAMA reached its all-time high on Oct 1, 2024 with the price of 688.90 INR, and its all-time low was 3.05 INR and was reached on Apr 1, 2003. View more price dynamics on SAREGAMA chart.
See other stocks reaching their highest and lowest prices.
See other stocks reaching their highest and lowest prices.
SAREGAMA stock is 3.44% volatile and has beta coefficient of 0.80. Track SAREGAMA INDIA LTD stock price on the chart and check out the list of the most volatile stocks — is SAREGAMA INDIA LTD there?
Today SAREGAMA INDIA LTD has the market capitalization of 93.50 B, it has decreased by −4.00% over the last week.
Yes, you can track SAREGAMA INDIA LTD financials in yearly and quarterly reports right on TradingView.
SAREGAMA INDIA LTD is going to release the next earnings report on Aug 1, 2025. Keep track of upcoming events with our Earnings Calendar.
SAREGAMA INDIA LTD revenue for the last quarter amounts to 2.41 B INR, despite the estimated figure of 2.94 B INR. In the next quarter, revenue is expected to reach 2.35 B INR.
SAREGAMA net income for the last quarter is 601.30 M INR, while the quarter before that showed 623.10 M INR of net income which accounts for −3.50% change. Track more SAREGAMA INDIA LTD financial stats to get the full picture.
EBITDA measures a company's operating performance, its growth signifies an improvement in the efficiency of a company. SAREGAMA INDIA LTD EBITDA is 2.77 B INR, and current EBITDA margin is 23.65%. See more stats in SAREGAMA INDIA LTD financial statements.
Like other stocks, SAREGAMA shares are traded on stock exchanges, e.g. Nasdaq, Nyse, Euronext, and the easiest way to buy them is through an online stock broker. To do this, you need to open an account and follow a broker's procedures, then start trading. You can trade SAREGAMA INDIA LTD stock right from TradingView charts — choose your broker and connect to your account.
Investing in stocks requires a comprehensive research: you should carefully study all the available data, e.g. company's financials, related news, and its technical analysis. So SAREGAMA INDIA LTD technincal analysis shows the sell today, and its 1 week rating is sell. Since market conditions are prone to changes, it's worth looking a bit further into the future — according to the 1 month rating SAREGAMA INDIA LTD stock shows the buy signal. See more of SAREGAMA INDIA LTD technicals for a more comprehensive analysis.
If you're still not sure, try looking for inspiration in our curated watchlists.
If you're still not sure, try looking for inspiration in our curated watchlists.