SBICard - Weekly Wave 3 As Seen on chart is the weekly wave count of SBICard
Wave 3 will occur once its close is above the triangle for a Wave 3 target of1550 levels
Wave 4 should retrace to a maximum of 1240 levels
Wave 5 Target of 1640 levels
SBICARD trade ideas

SBICARD good for Investment with technical analysisSBICARD giving breakout at 1140 in the monthly chart.
SL is 883 closing basis


SBI Cards Short TermThe stock has reached lower trend line and took support and is ready for a reversal rally. Trade is supported by brokerage calls and Supports Nearby.

SBI Cards is at the bottom of its weekly trend linesSBI Cards has been moving between 2 trend lines. It just hit the bottom line and bounced back up.
It can be a good buy to ride a wave till the top exit line.

SBI CARD - JACKPOT CALLBuy Above 993 Closing above daily candle - T1: 1031, T2: 1068, T3-1200
Sell Below 963 Closing below daily candle- T1: 933, T2: 894, T3-816
Guaranteed Target.

SBI Cards turning bearish!! Candle has shown breakdown from channel on weekly close. Wait for a retest. Until then watch closely.

SBI Cards-Buy around 920 to 940Buy around 920 to 940
Stop Loss 875
Target: 990 // 1029 // 1059 // 1090
Do your due diligence this is not investment advise
Please follow me for more ideas and update

SBICARD : Buying at the current levelsThe current issues related to Carlyle arm selling stake, is not a major concern for the overall growth of the stock. This is just a temporary issue and I see this as an opportunity to buy. Will be adding on if price dips to the other two inflection points mentioned herein. Will be selling only when price reaches the top of the channel line.


Good supply on weekly chart of SBICARD.NSE:SBICARD
Good supply visible on weekly chart of SBICARD which may lead stock to move down toward 918 and 765. Any closing below last weeks low on daily chart will be good confirmation for same.
this view will be invalid if we see closing above 1105.

SBICard - LongNSE:SBICARD
This is a good opportunity to enter long/ invest in SBICards at around 900/- Looks promising


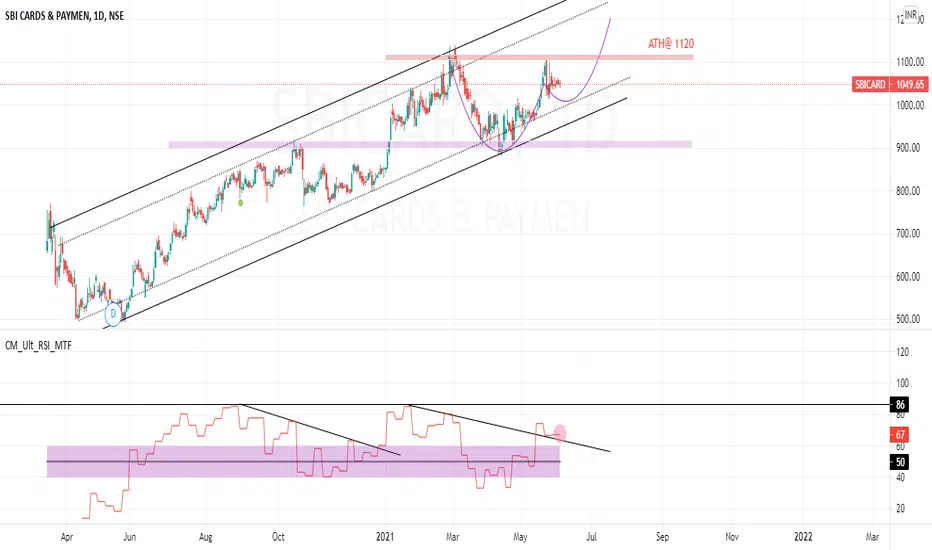
Bullish on SBI card- Cup & Handle pattern
- Above short & long term moving averages
- Target 1290-1300

SBICARD Trending up towards 1100 levelsSBIC card has come into motion and is probably moving towards 1080- 1100 levels,
Please refer to the previous post of sbic, linked here.

it is forming a cup & handle patternKeep this stock in your watch list if it completes cup & handle pattern you could expect a good break out


SBI CARD - Full movementumAfter forming an inverted head and shoulder pattern stock is in full uptrend. NSE:SBICARD


SBICARD consolidating at imp levelsOn 6the May 2021, the stock saw a gap up opening, followed by a big bull candle, which further followed by sideways move same and next trading day, i.e today.
Seeing this price action, if the price sustains 970 levels, it could head towards 1040 and 1080 levels in the very near term.

buy sbi cardsbi card has form inverse head & shoulder pattern in 2hr chart. we may see 1085 in coming days. view negated below 950
