SBIN🧠 Technical Logics Highlighted
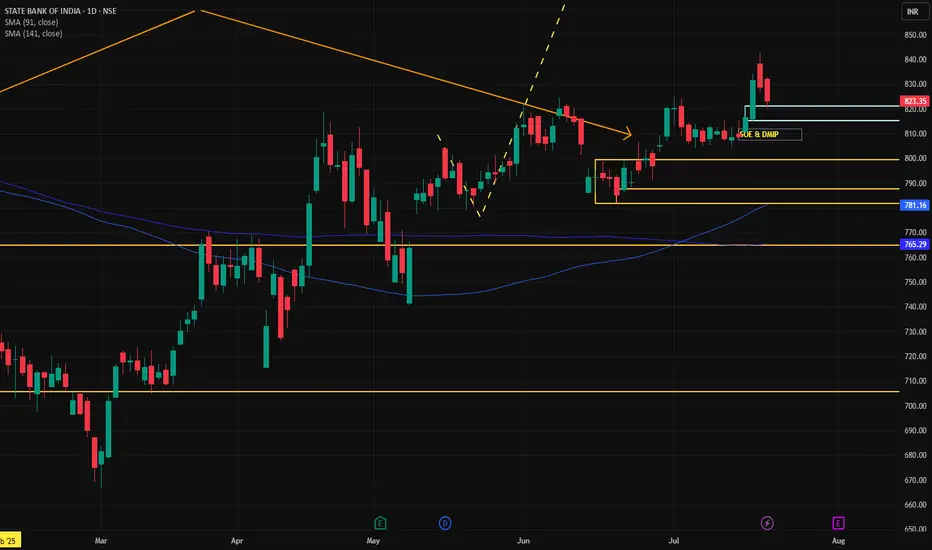
Qtrly BUFL Zone is respected – strong confirmation of demand at 765–705.
Weekly ASZ previously formed at 793, reinforcing buyer interest.
Engulfing Pattern with DMIP & SOE confirms buying strength.
Current price trades above Gann Level (766) – a technical sign of strength.
💼 Trade Plan – Long (BUY)
Parameter Value
Entry 817
Stop Loss (SL) 810
Risk 7 pts
Target 1045
Reward 228 pts
Risk:Reward Ratio (RR) 32.6 (Excellent!)
📊 Additional Technical Levels
Metric Value
Last High 894
Last Low 666
Point Var 228
✅ Final Commentary
Risk-Reward (RR) of 32.6 is outstanding – even a few successful trades of this kind can yield massive returns.
Entry point (817) sits perfectly within high-probability zones, aligned with strong daily/60M demand levels (814–821).
Stop-loss (810) is tight and efficiently placed just below the key proximal demand.
Target (1045) is ambitious but justifiable with the current bullish structure and price action.
🔔 Suggested Next Steps
Set alerts near 810 and 821 to monitor price reaction.
Watch for confirmation candles or volume spikes at 817.
Lock partial profits if price nears 894 (previous high), and trail SL to secure gains.
🔍 Trend & Demand Zone Summary
Timeframe Trend Proximal Distal Avg Demand Zone
HTF (High TF) UP 680 621 650
MTF (Mid TF) UP 795 761 778
ITF (Intraday TF) UP 807 803 805
✅ Conclusion: All timeframes indicate a strong bullish trend. Price is moving upward from demand zones across HTF, MTF, and ITF levels.
SBIN trade ideas
SBIN✅ Updated Trade Plan Summary
✅ Updated Trade Plan Summary
Metric Previous Value Updated Value
Entry 800 800
Stop Loss (SL) 757 775
Risk 43 25
Target 1256 1256
Reward 456 456
Risk-Reward (RR) 10.6 18.2
🔍 Implications of the Change
🔽 Risk reduced from 43 to 25 points
✅ RR improved significantly from 10.6 to 18.2, showing a more optimized entry
🔐 Stop Loss at 775 is now just below the Daily Demand zone (775–757) — tighter but still inside structure
🎯 Target remains the same, making the setup more efficient from a capital allocation and position sizing standpoint
⚠️ Caution Point
SL is just at the edge of the Daily Proximal Zone. If there's volatility and a liquidity grab below 775, there’s a minor risk of being wicked out before direction resumes.
You may consider partial entry or buffer SL at 770 if price volatility is high.
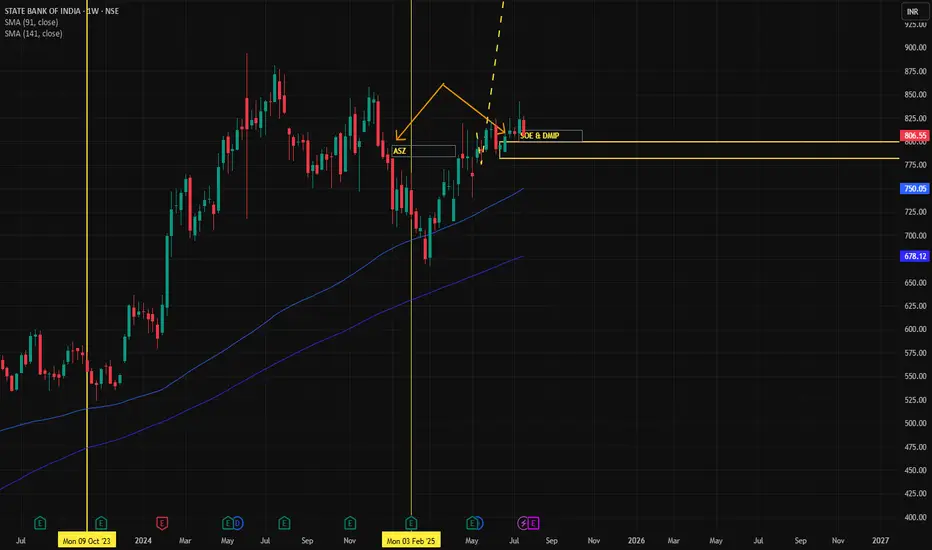
🧠 Key Trade Logic Still Holds
All Higher, Mid, and Intraday Timeframes show strong UP trend.
ASZ + DMIP + SOE confirmation from Weekly zone at 799 still valid.
Price trades well above Gann level of 766 and above ITF Demand clusters (782–787).
Weekly Demand at 800–780 is your live demand engine.
📌 Supportive Zones Recap
Timeframe Demand Zone (Proximal–Distal)
Weekly 800 – 780
Daily 775 – 757
ITF (Avg) 788 – 782
📈 Conclusion
This is an optimized entry with better RR (now 18.2), assuming volatility is managed.
Good structure, strong MTF alignment, and you're sitting inside the Weekly Demand Zone.
Monitor 775-770 zone — if broken with volume, re-evaluation may be needed.
SBIN (Swing Trade) LONGThis stock has broken out of a trend line and looking good for a good upper move. Current CMP is 835, book your profit on 900 , SL will at last swing(805) .

SBIN , 1W , Bullish As the Pattern is Formed and given Breakout , enter after strong candle close in weekly Timeframe and put SL below Swing low . follow proper risk management
follow for more swing ideas like this

STATE BANK OF INDIA IN A BULLISH MOMENTUMThe technical setup suggests bullish momentum with Elliott Wave supporting continuation higher. Key upside levels are ₹850 and ₹880, as long as the price holds above trend support near ₹820-₹830. A failure below this zone would weaken the bullish outlook.

Importance of ATR(Average True Range)So idea here is to calculate risk.
understanding fear in the market ATR is an indication of volatility , not direction.
A smaller ATR range means low volatility.. tentatively market is consolidating.
A larger ATR range means the market is dealing with uncertainty so volatility has increased.
you can see the value of ATR on your chart.
the value of past ATR14period value is be greater than current ATR14 Period to take risk on a trades. it will help you reduce risk.

SBI - My Pick - No Financial Advice - VCP PatternAfter a recent upside rally SBI has retraced approx 8.5% from the resistance zone of 825-830, theafter second compression of 5% occurred. Thus I see sucessive Volatility contraction. Recent Golden Cross over clubbed with VCP is indication of good buying opportunity. Short to mid-term momentum is bullish, underpinned by strong moving averages and recent bullish crossover. My entry depends upon good bullish close with good volumes.

Buy above 817 fast target 873Everything mention about in my chart
buy price range cmp -811.85
stop loss - 797 day closing
fast target - 873
I am not sebi reg
is my own idea only

SBIN | Buy @LTP | SL below 776 | Targets 880, 970Disclaimer:
This is not financial advice. Please do your own research or consult with a financial advisor before making any investment decisions. Investments in stocks can be risky and may result in loss of capital.

SBIN - VCP formationThe sector has a whole is lagging the broader market, private banks and financial services have been the leaders. Position size should be in check. Wait for trendline breakout for an ideal entry. This is a long term play.

SBIN📝 Trade Plan
Position: Long (Buy)
Entry: 800
Stop Loss: 757
Risk: 43 points
Target: 1256
Reward: 456 points
Risk-Reward (RR): 10.6 – Excellent
✅ Multi-Timeframe Trend & Demand Zone Alignment
Zone Trend Demand Logic Avg Demand Zone
HTF UP RBR, BUFL 650
MTF UP RBR, DMIP, SOE, BUFL 762
ITF UP DMIP, BUFL 785
Trade Point Avg 732
This shows full timeframe alignment (HTF, MTF, ITF) in UP trend, strengthening the case for a long trade.
✅ Key Trade Logics – Highlights
Quarterly Demand (BUFL) is being respected.
Weekly ASZ previously formed at 793 – now engulfed with DMIP + SOE at 799 → Strong Demand.
Price trading above Gann Level of 766 → Bullish confirmation.
Entry at 800 is just above all critical demand structures (DMIP, BUFL, ASZ).
✅ Technical Observations
Last High = 894 → Short-term resistance.
Target = 1256 → Ambitious but possible if structure breakout confirms.
Last Low = 666 → Strong swing low. SL at 780 protects this level.
⚠️ Considerations / Watch Points
Immediate Resistance: ₹894 (last high); could act as short-term hurdle.
Gap Risk: Entry very close to Weekly demand zone (780–800) – be cautious of volatile retests.
Target Realism: ₹1256 may require a multi-week/month hold; consider scaling out partially at swing levels (e.g., ₹894, ₹975, ₹1050).
Reconfirm with Volume: Check for breakout with rising volumes above 800 and around 894 zone.
✅ Verdict
This is a strong, high-conviction trade setup with:
Perfect MTF Trend Alignment
Tightly defined risk
Excellent R:R ratio
Strong structural demand support
STATE BANK OF INDIA at Best Support !!This is the 4 hour Chart of STATE BANK OF INDIA.
SBIN is having good Support at 770 range.
SBIN is moving within an ascending channel, with a support zone in the range of 770–780.
If this level is Sustain ,then we may see higher prics in SBIN.
Thank You !!

SBIN has given a Spring SBIN 779 has given a Spring pattern for target 811.
Positive volume comparatively more.


SBI towards 650? Butterfly pattern to complete "W"SBI is on the verge to form Butterfly pattern it has potential to reach 650 target with following support.
720 / 700 / 680 / 650

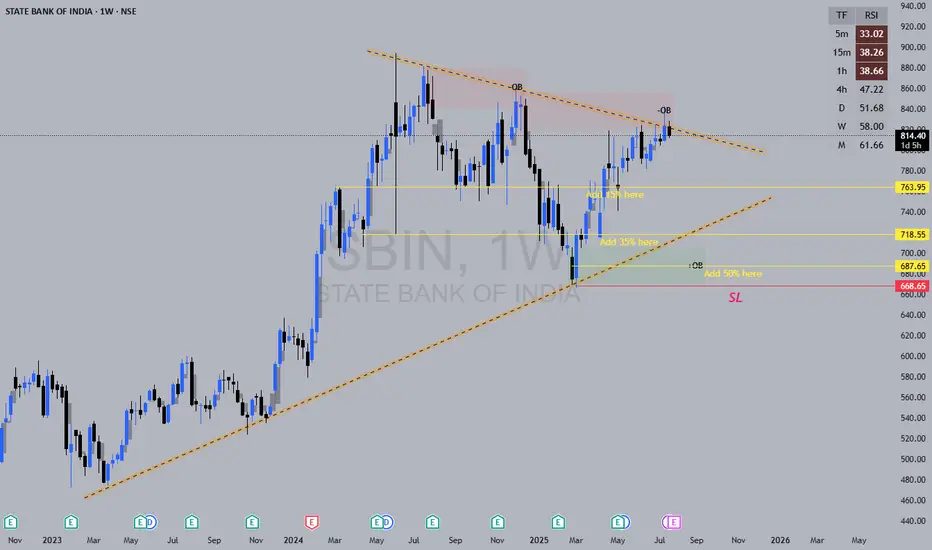
SBIN Weekly Levels and reportLook at the Weekly Chart:
This will show you how SBIN’s price has moved each week.
Identify Support and Resistance:
Support is where the price usually doesn’t fall below (like a floor).
Resistance is where the price often doesn’t go higher than (like a ceiling).
Example: If SBIN’s price bounced off ₹590 a few times, that’s support. If the price keeps struggling around ₹640-650, that’s resistance.
Check for Fibonacci Levels (Optional):
You can use a tool that shows you Fibonacci retracement levels. It helps find where prices might bounce or reverse.
Key levels to watch for are 38.2%, 50%, and 61.8% retracements from a big move (up or down).
Draw Trendlines:
If SBIN has been moving up, draw a line connecting the lows to see where it might find support in the future.
If it’s in a downtrend, connect the highs to see where resistance might be.
Check the Moving Averages:
The 50-week and 200-week moving averages can show if the stock is generally moving up or down.
If SBIN is above the 50-week average, it might be in a bullish (up) trend.
If it’s below the 200-week average, it might be in a bearish (down) trend.
Look for Round Numbers:
Prices like ₹600, ₹650, ₹700 are often seen as psychological levels. Traders often watch these prices because they’re easy to remember.
Example:
If SBIN recently bounced off ₹590 or ₹600 multiple times, that’s support.
If it keeps facing resistance around ₹640 or ₹650, those are resistance levels.
Final Thoughts:
If SBIN’s price breaks above resistance (say ₹650), it might go higher.
If it falls below support (say ₹590), it might drop further.

Fake Break out Down Side. You Know What's Next ?#sbin has made a flag and pole pattern on the weekly timeframe, and formed a fake breakout also.

SBI Trading IdeaNSE:SBIN is movement. Once this crosses 792, its good to Buy and the Target would be 850

State Bank of India view for Intraday 20th May #SBIN State Bank of India view for Intraday 20th May #SBIN
Resistance 810 Watching above 811 for upside momentum.
Support area 780 Below 800 ignoring upside momentum for intraday
Watching below 778 for downside movement...
Above 800 ignoring downside move for intraday
Charts for Educational purposes only.
Please follow strict stop loss and risk reward if you follow the level.
Thanks,
V Trade Point

SBIN📈 Updated BUY Trade Plan – SBIN
Trade Component Value
Entry 775
Stop Loss (SL) 757
Risk 18
Target 995
Reward 220
Risk-Reward Ratio 12.2
Last High 900
Last Low 680
SBIN – Updated MTF Demand Zone Analysis
🔹 Higher Time Frame (HTF) Demand Zones
Timeframe Trend Proximal Distal Average
Yearly UP 660 500 580
Half-Yearly UP 660 600 630
Quarterly UP 660 600 630
HTF Average 660 567 613
🔹 Medium Time Frame (MTF) Demand Zones
Timeframe Trend Proximal Distal Average
Monthly UP 660 600 630
Weekly UP 738 719 729
Daily UP 775 757 766
MTF Average 724 692 708
🔹 Intraday Time Frame (ITF) Demand Zones
Timeframe Trend Proximal Distal Average
240 Min UP 775 757 766
180 Min UP 775 757 766
60 Min UP 775 757 766
ITF Average 775 757 766
✅ Consolidated Trade Points
Metric Value
Proximal Avg 720
Distal Avg 672
Combined Avg 696
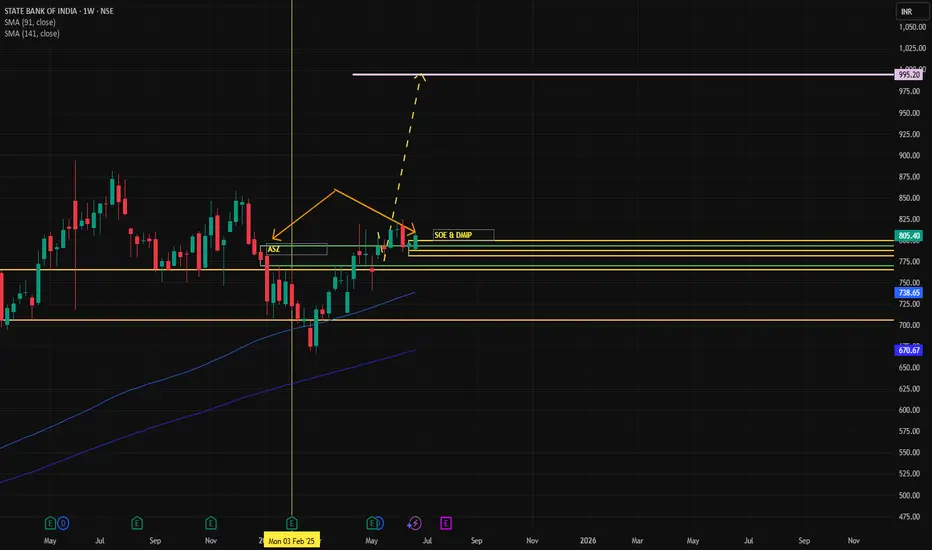
✅ Strengths of the Setup:
All timeframes (HTF, MTF, ITF) show a strong UP trend, indicating alignment and directional strength.
Entry (775) is on a well-established Daily + Intraday demand zone → offering a solid support area.
Despite lowering the target from 1144 to 995, the RR remains high at 12.2, making this a still-attractive trade.
Target (995) is a reasonable swing move and sits well above the last high of 900, aiming for a new price discovery.
⚠️ Risks / Things to Monitor:
SL is tight (757); price could spike near it before moving higher—consider having a buffered SL or confirmation-based entry if volatility increases.
If the price retraces below 757, it would invalidate the current demand zone strength in the short term.
Conclusion:
This remains a high-conviction long trade, albeit with a slightly moderated target for a quicker reward realization. Strong confluence across all timeframes supports your trade thesis. Great RR, disciplined stop loss, and aligned demand zones offer a technically sound plan.
A dynamic exit strategy
Scaling plans (partial exit at 900)
Alternative SL strategies or re-entry if SL hits

State Bank of India view for Intraday 15th May #SBIN State Bank of India view for Intraday 15th May #SBIN
Resistance 810 Watching above 811 for upside momentum.
Support area 780 Below 800 ignoring upside momentum for intraday
Watching below 778 for downside movement...
Above 790 ignoring downside move for intraday
Charts for Educational purposes only.
Please follow strict stop loss and risk reward if you follow the level.
Thanks,
V Trade Point

SBIN is above breakout levelSBIN just crossed breakout level of 792.25 and now in bullish zone. Expected to cross 850 level. Stop loss is 782.75 (Reversal level as mentioned on chart)
Note: This is not a buy/sell trade call. It is an analysis.
