SBIN Long Elliot Wave 5 playBuy at CMP with SL below 315. Wave 5 Tgt are (1) Wave 3 top (2) Anywhere between 0.382 to 0.618 FIB levels from Wave1 to 3.
SBIN trade ideas

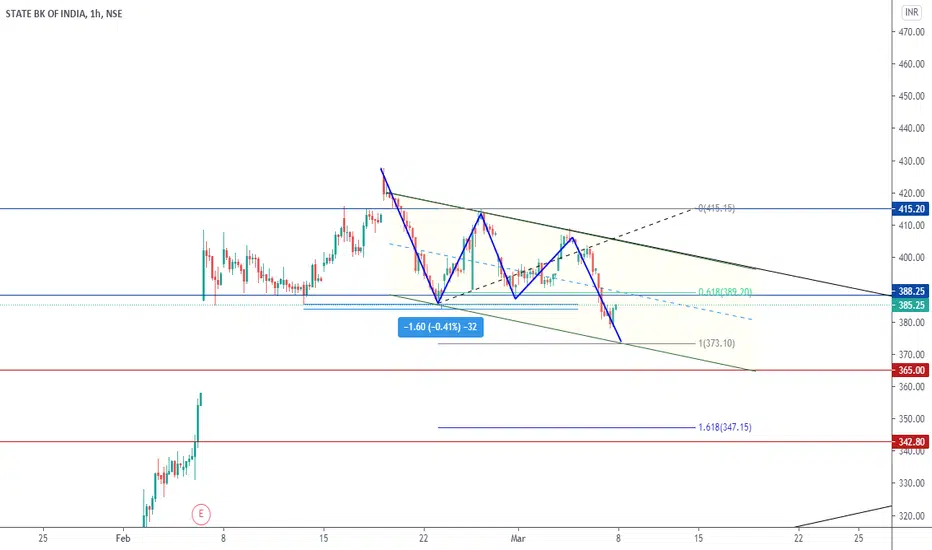
sbin short below 360 SBIN facing resistance at 365 , a very strong resistance at this level , short it below 360 with target of 349 and buy above 365 only when it sustain minimum 15 min candle with satisfying volume .
let's see where nifty opens tomorrow
disclaimer:- these are my personal views .

SBINChannel breakout in Daily Tf at the same time closing above 50ema showing a upside move. RSI on a crucial level of 50
if breaks 364 on Daily TF can see a upmove till 400


SBIN : Expected to launch shortly!Certainly a downtrend since a month has been observed. Now according to market/bankNifty movement, a. decent breakout is expected in the short run.

SBIN 15It's a prediction the if market breaks either of the levels then it will move accordingly.
Disclaimer: it's as per my study/analysis, so sharing just for knowing whether I am correct or not. (Knowledge Purpose)

Double top and Inverted H & SShort SBI
Reasons:
Double Top Pattern
Inverted H & S
Trying to fill the Gap
(Imp levels mentioned)
(Only for demonstration)

STATE BK OF INDIA 4HR
CONFLUENCE Of DAILY & 4HR Bullish Bat
Price need to follow GREEN TREND LINE and hit Target 1 & 2 , else if Price BREAKS RED TREND LINE is EXIT
POTENTIAL BUY


POSITIOAL INVESTMENT VIEW IN #SBINPOSITIOAL INVESTMENT VIEW IN #SBIN
SBIN LOOKING VERY STRONG CMP 320 KEEP ADDING TILL 190
STOP LOSS - 170 CLBS
TARGET -370 430 470 520 +++ NEW HIGH

SBIN is in BUYING ZONE SBIN will breakout from short term trend line also at support and you can see gap has been filled you can buy for a short term target of 420-500

Possible uptrend based 15mins ChartPrevious Close as on Friday, April 9th, 2021: ₹353
Buy at: ₹354.50 (during uptrend)
1st Target Price: ₹356
2nd Target Price: ₹359
Ambitious Target: ₹360 - ₹363
Stop-Loss: ₹ 350
Trailing SL: After reaching each target price
Duration: Intraday on Monday, 12th April (based on 15mins chart)
Not guaranteed as the stock market is subjected to market risks. These calls are based on my own research and are meant for paper trading. Please do your own research if you are interested in investing or trading in the stock market.


SBIN INTRADAY 5 APR,2021Dear trader,
If u look at the chart of SBIN (analysis based intraday only) the SBIN support at 351 and Target at 346 and stop loss at 357.
The chart clearly indicates Bullish Trend you can also see the candle stick patters for more indepth analysis.
In Intraday most important thing is to enter and exit points.
Our signals are based on analytics, algorithms, mathematical derivatives.
Always be a responsible trader, kindly trade only when you have maximum opportunity in the market with minimum risk and with keynotes like data, analysis and proper strategies.
Kindly message us for strategies and analysis.

Good to go LongStatistical Brief
Market Cap₹ 330,791 Cr.
Current Price₹ 371 High / Low₹ 428 / 149
ROE6.79 % ROE 3Yr2.02 % ROE 5Yr2.54 %
Return over 1year111 % Return over 3years12.6 % Return over 5years15.0 %
Profit growth66.6 % Profit Var 3Yrs179 % Profit Var 5Yrs-0.63 %
Stock P/E16.1 Industry PE20.4 CMP / FCF-23.4
Current Resistance @ 375 Trend Positive
Target - First 400 Target - Second 550
Support 345 Pattern Cup & Handle

SBIN After a down trend took support of the gap and also from the 200 ema(in daily time frame). In 1 hr time frame closed above 200 ema. Good for buying in SBIN now if bank nifty goes green next week.

SBIN LongSBIN
Healthy pattern on the D time frame of SBIN. There is a candle entirely above the trendline. We may have missed that move but it seems there is a lot more coming. Targets given on chart. Position can be initiated with a trailing stop loss as per risk appetite.
Do your own research before entering.

