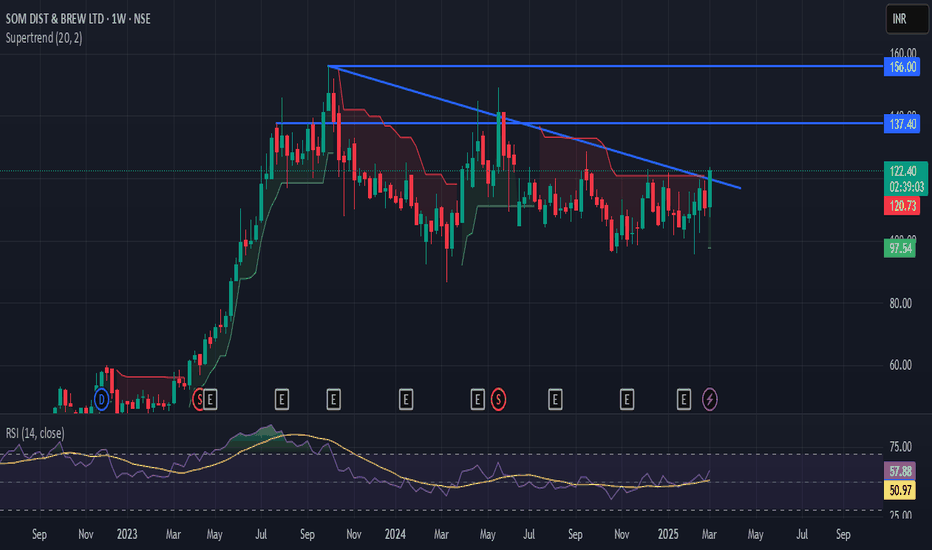
SDBL trade ideas
somWhat you’re looking at here is a **battle of the bulls and bears** brewing in SOM Distilleries and Breweries Ltd. This chart isn’t just a picture of price movements—it’s a story of indecision, tension, and a potential explosion waiting to happen!
🔍 **The Triangle of Suspense**
That symmetrical triangle? It’s like a coiled spring—energy is building, and the market is whispering, "Something big is coming." The stock has been bouncing between the upper resistance and lower support like a caged tiger, just waiting to leap.
Lower Highs & Higher Lows**: Neither side is giving up, creating this dramatic convergence.
Think of this triangle as the calm before the storm. When it breaks, it's going to **ROAR**—but the question is, **which way?**
- 📉 **Today’s Red Candle: A Warning Sign or a Head Fake?**
The stock closed 3.39% down at ₹104.65—a cautious dip near the lower edge of this triangle. Is this just a fake-out to shake out the weak hands, or a sign the bears are ready to pounce?
**Volume tells the story**—the low volume recently suggests the big players are waiting. But don’t be fooled; once they step in, this thing could **erupt like a volcano.
🚀 **The Bullish Scenario: Breaking Free**
If the price breaks **upwards**, the stock could be heading back to the ₹140-₹160 range, reclaiming its throne and delivering a king-size rally for its investors. You’ll want to keep an eye out for **big volume spikes**—that’s the bulls roaring into action.
🐻 **The Bearish Scenario: Danger Below**
If the price crashes below the support line (₹100), this tiger might just lose its claws. The downside could see it tumble toward₹90 or even₹80, giving short-sellers their moment of glory.
🎯 **Your Takeaway: The Moment of Truth**
This is not just another boring stock chart. It’s a **cliffhanger**, a build-up to a potential breakout or breakdown. Whether you’re a trader looking for action or an investor eyeing a long-term play, this is your moment to sit up and watch closely. The decision point is near, and the market is about to show its cards.
Note: im not expert so take own risk
Som dist & brew ltdCurrently price on strong support zone ,
And RSI also show support on monthly and weekly base.
But I think this is Wave C ---> wave 3 running maybe I'll wrong.
If price break support zone after consolidation, then next best zone is 225 around,
(Here harmonic shark, volume, I think 5th and wave c 100% complete)
Personally thinking both zone interesting 245 near , and 225 near, also promoters bought some stake.
Best way to enter is pyramid.
SDBL clear break out Highest weekly closingA sequence of consolidation patterns in a stock may imply that it is preparing for a noteworthy movement, and if it is trading above important moving averages, it may indicate a robust bullish trend. Furthermore, breaking through the recent all-time high level is a distinct indication of the stock's upward momentum.
It is essential to trade with prudence and thoughtfully analyze your risk management plan before executing any trades. Wishing you a successful trading experience!
Indian Liquor StocksThis is custom index of Indian Liquor listed stocks with equal weight. It seems that the whole index is going up and new Russian Market demand is driving the same. Actual increase in profit will come after quarter end but as market is discounting machine price will move up ahead of actual results in expectations.
SDBL ROUNDING BOTTOMSom dist. looking good on charts on 116.5 - 117.
Rounding boottom can be seen now consolidating maybe breakout is near on.
volumes rising buying interest seen in the stock.
RSI positive near 62
if we see fibo levels on weekly basis targets are huge 127 if move above it 140 and 192 is the target.
shall watchout for the stock nicely placed.
if someone buys see 105 as sl.
Disclaimer : not a recommendation mainly for educational purpose.
Som Distilleries & Breweries LTD- Multiple Indicators + Risky 📊 Script: SDBL (SOM DISTILLERIES & BREWERIES LIMITED)
📊 Nifty50 Stock: NO
📊 Sectoral Index: NIFTY 500
📊 Sector: Fast Moving Consumer Goods
📊 Industry: Breweries & Distilleries
Key highlights: 💡⚡
This stock pick is according to my study. I have use few indicator that is
BOLLINGER BAND
MACD
RSI
DOUBLE MOVING AVERAGE
VOLUME
📈 Script is trading at upper band of Bollinger Bands (BB) and giving breakout of it.
📈 Crossover in MACD .
📈 Already Crossover in Double Moving Averages.
📈 Current RSI is around 68.
📈 One can go for Swing Trade.
⏱️ C.M.P 📑💰- 110
🟢 Target 🎯🏆 - 118
⚠️ Stoploss ☠️🚫 - 106
⚠️ Risk Hai Toh Ishq Hai
⚠️ Important: Always maintain your Risk & Reward Ratio.
⚠️ Purely technical based pick.
✅Like and follow to never miss a new idea!✅
Disclaimer: I am not SEBI Registered Advisor. My posts are purely for training and educational purposes.
Eat🍜 Sleep😴 TradingView📈 Repeat🔁
Happy Navaratri 🕉️ 💃🏻🕺🏻
Happy learning with trading. Cheers!🥂


