SEAMEC LTD S/RSupport and Resistance Levels:
Support Levels: These are price points (green line/shade) where a downward trend may be halted due to a concentration of buying interest. Imagine them as a safety net where buyers step in, preventing further decline.
Resistance Levels: Conversely, resistance levels (red line/shade) are where upward trends might stall due to increased selling interest. They act like a ceiling where sellers come in to push prices down.
Breakouts:
Bullish Breakout: When the price moves above resistance, it often indicates strong buying interest and the potential for a continued uptrend. Traders may view this as a signal to buy or hold.
Bearish Breakout: When the price falls below support, it can signal strong selling interest and the potential for a continued downtrend. Traders might see this as a cue to sell or avoid buying.
20 EMA (Exponential Moving Average):
Above 20 EMA(50 EMA): If the stock price is above the 20 EMA, it suggests a potential uptrend or bullish momentum.
Below 20 EMA: If the stock price is below the 20 EMA, it indicates a potential downtrend or bearish momentum.
Trendline: A trendline is a straight line drawn on a chart to represent the general direction of a data point set.
Uptrend Line: Drawn by connecting the lows in an upward trend. Indicates that the price is moving higher over time. Acts as a support level, where prices tend to bounce upward.
Downtrend Line: Drawn by connecting the highs in a downward trend. Indicates that the price is moving lower over time. It acts as a resistance level, where prices tend to drop.
Disclaimer:
I am not a SEBI registered. The information provided here is for learning purposes only and should not be interpreted as financial advice. Consider the broader market context and consult with a qualified financial advisor before making investment decisions.
SEAMECLTD trade ideas


SEAMEC LTD Analysis 01 July23As per my analysis, Buyers are getting strong to buy on NSE:SEAMECLTD . Best level to take buy entry is 661 with stop loss of 555 (-106) and my expected upside target would be 745 (+84) & 790 (+129). If price continue stay above 790 then it may reach up to level of 890 (+229)
Note: This is my personal analysis, only to learn stock market behavior. Thanks.

SEAMEC LTD BREAKOUTNSE:SEAMECLTD broke out from a flag pole trend continuation pattern.
A momentum trade can be taken with a 1:3 RRR.
Targets: 1500/1600/1750+
sl below 1145

SEAMEC LTD ( EDUCATIONAL PURPOSE ONLY)There is no guarantee in stock market and Nothing over week
Always Invest or trade according to your loss bearing capacity
STOCK FOR EDUCATIONAL PURPOSE ONLY
WATCH SEAMEC LTD with target of RS 1190 CMP IS RS 1129.35
STOP LOSS: ACCORDING TO YOUR RISK APPETITE OR @ RS 1005
Disclaimer: I am not Sebi Registered. All my ideas/opinions and analysis are for your information and educational purposes only and it does not constitute any recommendation to buy or sell any stock or index. Use your own wisdom.
M B PANDEY
Student of Market since 2015
B.Sc. (MATHS & PHYSICS)
Disclaimer: I AM NOT SEBI REGISTERED

long seamecltdSeamecltd can buy here for long term 900+ tgt
as RS is strong
adx is strong
stock in 2nd stage


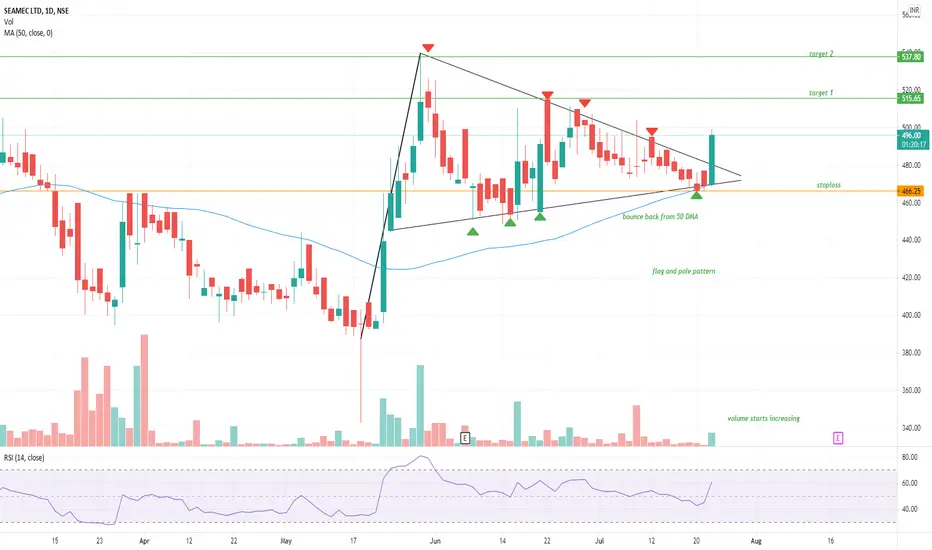
flag and pole pattern in SEAMEC LIMITEDFlag and pole pattern
triangle pattern breakout
bounce back from 50 DMA
volume starts increasing
outbreak is expected in few days
levels are depicted in chart
this is for education purpose only


SEAMEC - BULLISH PATTERNSEAMEC
CMP 293
Long suggested only above 303
Stop 278
Logic :
#VCP
Contraction in price witnessed
-13% first swing
-10% second swing
-7% third swing

