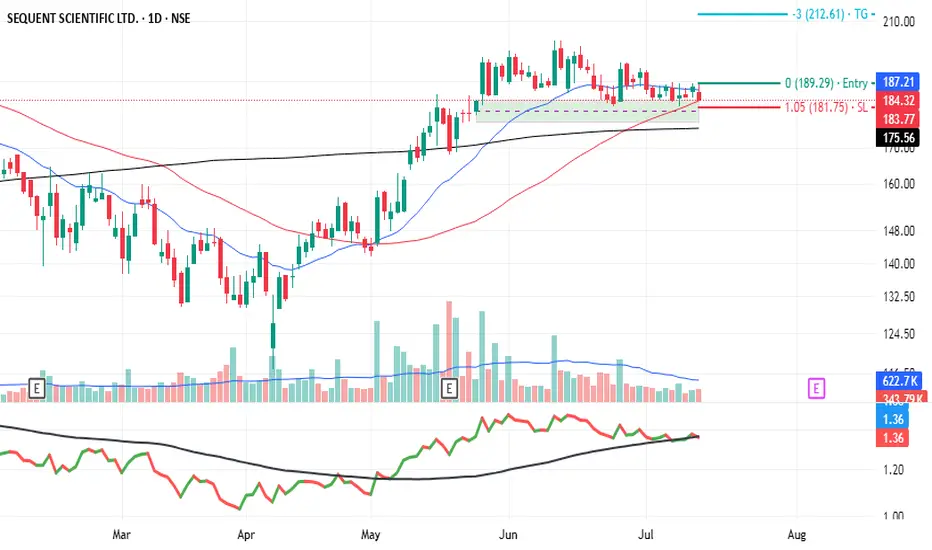
Sequent - My pick - No AdviceStrong Rally followed by period of consolidation with squeeze in volumes showing lack of selling pressure. Stock is resting at support level. if price drops below 180, could trigger stronger selling. A long-term investor may wait for a better entry near intrinsic value 155–160. Conversely and upsid
Next report date
—
Report period
—
EPS estimate
—
Revenue estimate
—
0.88 INR
218.78 M INR
15.49 B INR
118.61 M
About SEQUENT SCIENTIFIC LTD.
Sector
Industry
CEO
Rajaram Narayanan
Website
Headquarters
Mumbai
Founded
1985
ISIN
INE807F01027
FIGI
BBG000BHLRM2
SeQuent Scientific Ltd. engages in the manufacturing and development of veterinary pharmaceuticals and specialty chemicals. It operates through the following geographical segments: Europe, Asia, and Rest of the World. The company was founded on June 28, 1985 and is headquartered in Mumbai, India.
Related stocks
Good buying opportunity in Sequent ScientificBullish engulfing candle and taken support from a trendline. Sequent Scientific can go upto 181,192, 199 levels.

SEQUENT:NSE RBC&H 2Y-8M onDTF/WTF/MTF PositionalSEQUENT Analysis WTF
TRADE PLAN
ENTRY -200-205 25%Qty, 25% Qty @ 190 Add further above 225
SL -187
TARGET --01-243 @27% gain, TGT02--335 @75% gain from 202
Hold For a Year or TGT 2
Keep in your Priority Watch List
Chart Pattern :
STOCK has recently broken its 52W HIGH of 202 forming a 2Y-8M

#SequentscientificIn short term stock has made a reverse head and shoulder, then breakout with volumes and now breakout retest, Now near support level, yesterday made a dragonfly doji, which indicates a reversal on chart. Company has posted turnaround results on YoY and QoQ Basis. Stock Looking for a good upside. Buy

0.5 Fib levelGood volume build in daily and weekly timeframe.
Highest volume ever buildup in this IPO.
Price has crossed its 0.5 fib level with good volume.
Smallcap⚠️⚠️.
Fundamentals are Ok and improving.
NOTE: I do my analysis, do yours before trade.
Eat🍜 Sleep😴 TradingView📈 Repeat 🔁

SEQUENT SCIENTIFIC - Multi Year Breakout StockINVERSE HEAD & SHOULDER PATTERN BREAKOUT STOCK FOR SWING TRADING
> 2 Years of Inverse head & shoulder breakout
BUY PRICE : 155
SL : 125 (only for swing traders)
TARGET : 202, 250, 305 (100%)
Disclaimer - All information on this page is for educational purposes only,
we are not SEBI Registered

Inverted Head & Shoulder BreakoutThe stock has broken a 2.5 year Inverted Head and shoulder with 4x volumes. Buy at retracement range between 155-160 for a target of 375.

Sequent Scientific positionalAbove 40 EMA
Gap up on daily BO
weekly BO on large volume
Consolidation of more than 2 yrs
No over head supply on left side
Bumper results/EPS growing
Increasing RS

SEQUENT READY TO RALLY UPSIDE.SEQUENT has given a breakout with a big bar green candle, also have volume spikes. This gives a signal to buy SEQUENT.

SEQUENT- Analysis
Entry above 141 or 150
Expected Major targets - 172 or 178 if sustain above this then 206 then 221 then hold.
Minor Targets - 159 and 199
Stop loss - closing below 135 and strictly 120
Please do your due diligence before trading or investment.
*Comment or message me if you wish to see my

See all ideas
Summarizing what the indicators are suggesting.
Oscillators
Neutral
SellBuy
Strong sellStrong buy
Strong sellSellNeutralBuyStrong buy
Oscillators
Neutral
SellBuy
Strong sellStrong buy
Strong sellSellNeutralBuyStrong buy
Summary
Neutral
SellBuy
Strong sellStrong buy
Strong sellSellNeutralBuyStrong buy
Summary
Neutral
SellBuy
Strong sellStrong buy
Strong sellSellNeutralBuyStrong buy
Summary
Neutral
SellBuy
Strong sellStrong buy
Strong sellSellNeutralBuyStrong buy
Moving Averages
Neutral
SellBuy
Strong sellStrong buy
Strong sellSellNeutralBuyStrong buy
Moving Averages
Neutral
SellBuy
Strong sellStrong buy
Strong sellSellNeutralBuyStrong buy
Displays a symbol's price movements over previous years to identify recurring trends.
Frequently Asked Questions
The current price of SEQUENT is 174.98 INR — it has decreased by −1.65% in the past 24 hours. Watch SEQUENT SCIENTIFIC LTD. stock price performance more closely on the chart.
Depending on the exchange, the stock ticker may vary. For instance, on NSE exchange SEQUENT SCIENTIFIC LTD. stocks are traded under the ticker SEQUENT.
SEQUENT stock has risen by 2.00% compared to the previous week, the month change is a −5.35% fall, over the last year SEQUENT SCIENTIFIC LTD. has showed a 29.81% increase.
SEQUENT reached its all-time high on Jun 29, 2021 with the price of 336.50 INR, and its all-time low was 42.65 INR and was reached on Oct 9, 2018. View more price dynamics on SEQUENT chart.
See other stocks reaching their highest and lowest prices.
See other stocks reaching their highest and lowest prices.
SEQUENT stock is 4.59% volatile and has beta coefficient of 1.46. Track SEQUENT SCIENTIFIC LTD. stock price on the chart and check out the list of the most volatile stocks — is SEQUENT SCIENTIFIC LTD. there?
Today SEQUENT SCIENTIFIC LTD. has the market capitalization of 44.48 B, it has decreased by −0.36% over the last week.
Yes, you can track SEQUENT SCIENTIFIC LTD. financials in yearly and quarterly reports right on TradingView.
SEQUENT SCIENTIFIC LTD. is going to release the next earnings report on Aug 8, 2025. Keep track of upcoming events with our Earnings Calendar.
SEQUENT net income for the last quarter is 93.20 M INR, while the quarter before that showed 34.40 M INR of net income which accounts for 170.93% change. Track more SEQUENT SCIENTIFIC LTD. financial stats to get the full picture.
As of Aug 8, 2025, the company has 1.43 K employees. See our rating of the largest employees — is SEQUENT SCIENTIFIC LTD. on this list?
EBITDA measures a company's operating performance, its growth signifies an improvement in the efficiency of a company. SEQUENT SCIENTIFIC LTD. EBITDA is 1.59 B INR, and current EBITDA margin is 10.37%. See more stats in SEQUENT SCIENTIFIC LTD. financial statements.
Like other stocks, SEQUENT shares are traded on stock exchanges, e.g. Nasdaq, Nyse, Euronext, and the easiest way to buy them is through an online stock broker. To do this, you need to open an account and follow a broker's procedures, then start trading. You can trade SEQUENT SCIENTIFIC LTD. stock right from TradingView charts — choose your broker and connect to your account.
Investing in stocks requires a comprehensive research: you should carefully study all the available data, e.g. company's financials, related news, and its technical analysis. So SEQUENT SCIENTIFIC LTD. technincal analysis shows the sell today, and its 1 week rating is buy. Since market conditions are prone to changes, it's worth looking a bit further into the future — according to the 1 month rating SEQUENT SCIENTIFIC LTD. stock shows the buy signal. See more of SEQUENT SCIENTIFIC LTD. technicals for a more comprehensive analysis.
If you're still not sure, try looking for inspiration in our curated watchlists.
If you're still not sure, try looking for inspiration in our curated watchlists.