buy at zone - swingENTRY
- line marked is potential reversal zone ( PRZ)
- entry is strictly inside the zone
- look for buying confirmation in smaller time frame ( 15 minutes preferred )
EXIT
1. target
- mark fib retracement from C to latest swing low
- TGT 1 - 0.236
- TGT 2 - 0.382
- TGT 3 - 0.5 ( preferred target )
2. SL
- candle close below (PRZ)
- if u didn't get confirmation inside the zone , ignore this pick
- if candle close is below zone , this pattern becomes invalid . IGNORE THIS PICK
- RE-ENTRY can be done , if u again get buying confirmation inside the zone
SHALPAINTS trade ideas

buy at zone - swing pickENTRY
- line marked is potential reversal zone ( PRZ)
- entry is strictly inside the zone
- look for buying confirmation in smaller time frame ( 15 minutes preferred )
EXIT
1. target
- mark fib retracement from C to latest swing low
- TGT 1 - 0.236
- TGT 2 - 0.382
- TGT 3 - 0.5 ( preferred target )
2. SL
- candle close below (PRZ)
- if u didn't get confirmation inside the zone , ignore this pick
- if candle close is below zone , this pattern becomes invalid . IGNORE THIS PICK


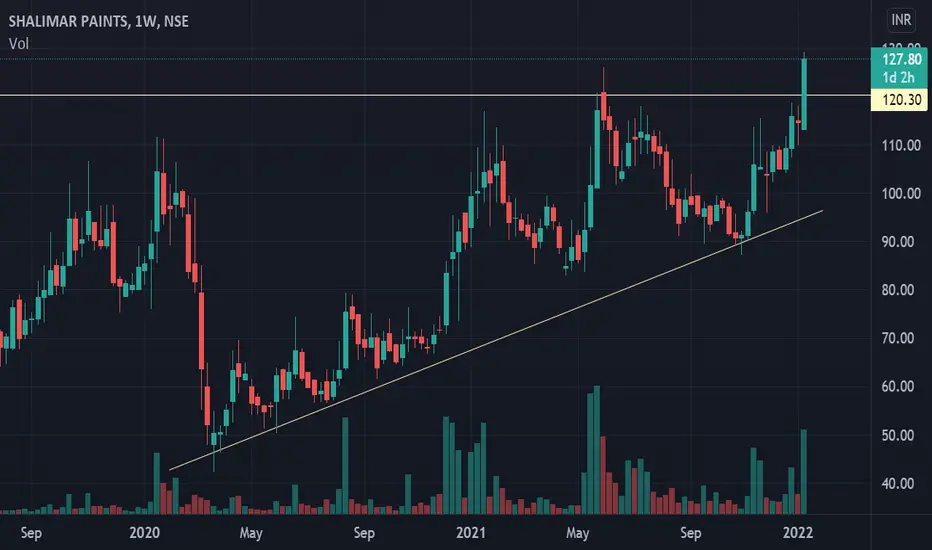
Triangle Pattern Breakout(Weekly TF) - SHALIMARPAINTSPlease look into the chart for a detailed understanding.
Consider these for short-term & swing trades with 4% profit (In my observation, I found that most of the stocks reached 3% to 4% on weekly basis)
Please consider these ideas for educational purposes.
Consider the above lines as upcoming resistances, if drawn any.

💥Shalimar Paints💥- Nice Breakout💥Shalimar Paints💥- Nice Breakout
Capital to be deployed- 20k
Investing Price -175-180
Breakout Price -171
Stoploss-151
Targets-219-252-350
RT for max reach.
#shalimarpaints #StocksToBuy #stocks #StocksToTrade #StocksInFocus #stockstowatch #StocksInNews

SHALIMAR PAINTS NSE BullishView above 150. CMP 158.5SHALIMAR PAINTS NSE is Bullish if 150 holds. Near 52 weeks High. Fresh Breakout. Positive Trend.
Disclaimer: Educational Purpose only. Not Buy/Sell Reco. Sebi unregistered.

Buy SHALPAINTSSafe Buy Shalimar Paints Above 133. One can even buy around 130 level.
There is a Small Resistance around 150-152 levels. However, journey towards 165 looks smooth in coming days.
T1: 163
T2: 189
Add more around 120-122 levels (on retracement)
SL: 109
Nice break with volume. Crossing resistance i.e above 133 will show good upmove. Looks good for mid-term.
#BreakoutStocks

SHALPAINTS NSE Shalimar Paints BULLISHVIEW BOVE 120 CMP 127.5SHALPAINTS NSE Shalimar Paints is bullish if 120 holds. New 52 Week High. Positive Trend. Fresh Breakout.
**** Educational purpose only. Not Buy/Sell Recommendations.
Shalimar paints seems bullishShalimar paints
may breakout H&S level
psychological level of 120 to be cross first

Breakout of channelShalimar has BO'd from channel and is moving up with good volumes...importantly it has also taken SUPPORT of 200 EMA. Targets marked..broader markets are sliding or consolidating so trade cautiously..this is an idea, not a recommendation. Shalimar is up 7% today

SHALPAINTS : Descending TriangleSHALPAINTS : Trading under Descending triangle pattern
- Levels are on charts
- Looking good if found near demand zone with small SL
- More entry above resistance zone
Like, Share, Comment for regular updates.
Disclaimer
I am not sebi registered analyst
My studies are Educational purpose only
Please consult with your Financial advisor before trading or investing

Shalimar paints has given a channel breakoutIt will be a good buy. Can add in dip. It may retouch the outer boundary of channel


SHALIMAR PAINTS - Breakout from Channel pattern - SwingThis analysis is purely based on price action and chart pattern.
Analysis is done on daily TF hence it may take several days to couple of weeks to reach its target.
Entry can be made above the high of today's candle or on small pull back to upper line of parallel channel.
Targets are shown in image. SL can be placed either below consolidation zone or below 87
Never Run after the price. Always plan your trade & trade your plan
Keep trailing SL accordingly once entered into the trade.
This analysis is purely for education purpose. Kindly do your own study before entering into any trade .
Feel Free to comment for any suggestion or query regarding price action analysis
Checkout my other ideas linked below.

SHALPAINTS reacts to monthly supportThis market has been in downtrend for quite some time. Recently there was strong momentum to the upside from 115 levels which is also a monthly support. One of the reason for extreme movement can be short covering. That price action changed the immediate market structure. 160 and 175 are key resistance areas.
RSI had bottomed out and the next swing high will also mark as the first key swing high to take a position. The plan is to wait for market to retrace to the area marked as ellipse and make an entry after confirming that price holds above the blue diamond. Immediate target is 160 and the rest with trailing stop loss.
