Charts Speak #Sharada Cropchem
Sharada Cropchem
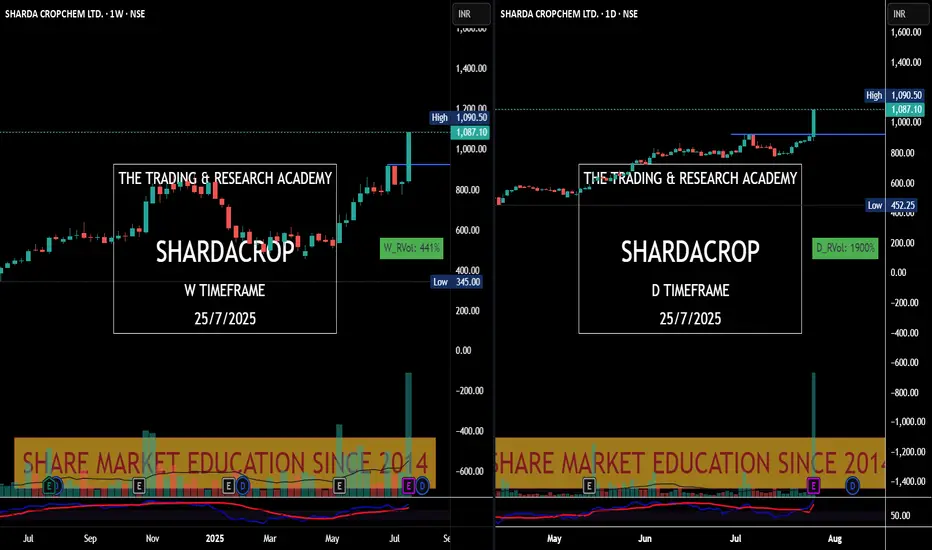
Charts always lead the News! This is yet another example where price was leading & News came later.
Stock was under accumulation since June with higher qty. In fact since May 25, it was getting bought in average 2-3M qty weekly. What a planned buying..
28th May, 4 June, 18th July were nice buying alarms for us. Today it was just a final nail in the coffin.
SHARDACROP trade ideas
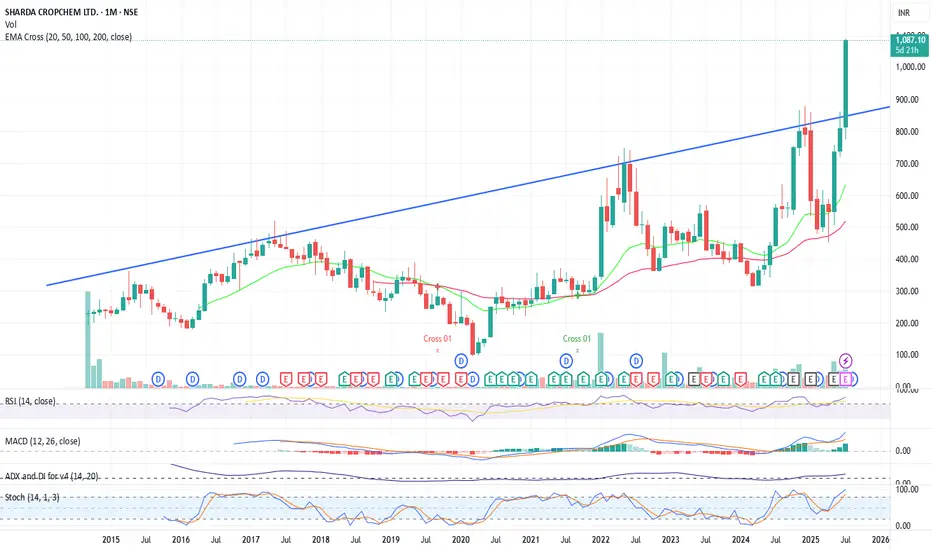
Ye Chart Kuch Kehta Hai - Sharda CorpchemIf you have been going through my post so far, you will understand this chart easily.
This is no brainer chart - one line explains a lot and that too on monthly chart.... Give your thoughts / comments, what do you think and how you interpret.
Sharda Cropchem - My trade Idea - No AdviceSharda Cropchem seems to be a BUY candidate. The stock's technicals suggest a strong buy signal, while the fundamental analysis indicates a stable financial performance and a decent valuation. The stock has a strong buy rating based on moving averages and RS line, with both short-term and long-term indicators suggesting a positive trend.
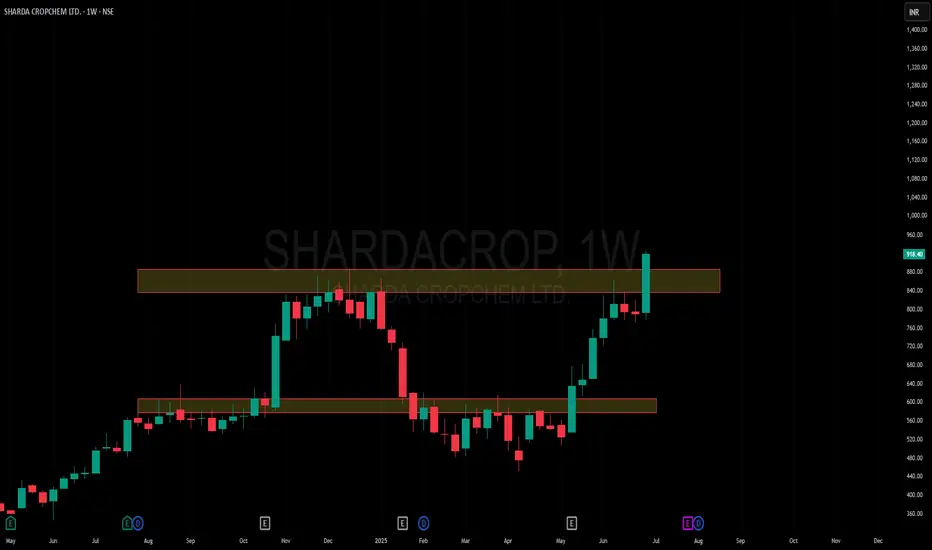
Amazing breakout on WEEKLY Timeframe - SHARDACROPCheckout an amazing breakout happened in the stock in Weekly timeframe, macroscopically seen in Daily timeframe. Having a great favor that the stock might be bullish expecting a staggering returns of minimum 25% TGT. IMPORTANT BREAKOUT LEVELS ARE ALWAYS RESPECTED!
NOTE for learners: Place the breakout levels as per the chart shared and track it yourself to get amazed!!
#No complicated chart patterns
#No big big indicators
#No Excel sheet or number magics
TRADE IDEA: WAIT FOR THE STOCK TO BREAKOUT IN WEEKLY TIMEFRAME ABOVE THIS LEVEL.
Checkout an amazing breakout happened in the stock in Weekly timeframe.
Breakouts happening in longer timeframe is way more powerful than the breakouts seen in Daily timeframe. You can blindly invest once the weekly candle closes above the breakout line and stay invested forever. Also these stocks breakouts are lifelong predictions, it means technically these breakouts happen giving more returns in the longer runs. Hence, even when the scrip makes a loss of 10% / 20% / 30% / 50%, the stock will regain and turn around. Once they again enter the same breakout level, they will flyyyyyyyyyyyy like a ROCKET if held in the portfolio in the longer run.
Time makes money, GREEDY & EGO will not make money.
Also, magically these breakouts tend to prove that the companies turn around and fundamentally becoming strong. Also the magic happens when more diversification is done in various sectors under various scripts with equal money invested in each N500 scripts.
The real deal is when to purchase and where to purchase the stock. That is where Breakout study comes into play.
Check this stock which has made an all time low and high chances that it makes a "V" shaped recovery.
> Taking support at last years support or breakout level
> High chances that it reverses from this point.
> Volume dried up badly in last few months / days.
> Very high suspicion based analysis and not based on chart patterns / candle patterns deeply.
> VALUABLE STOCK AVAILABLE AT A DISCOUNTED PRICE
> OPPURTUNITY TO ACCUMULATE ADEQUATE QUANTITY
> MARKET AFTER A CORRECTION / PANIC FALL TO MAKE GOOD INVESTMENT
DISCLAIMER : This is just for educational purpose. This type of analysis is equivalent to catching a falling knife. If you are a warrior, you throw all the knives back else you will be sorrow if it hits SL. Make sure to do your analysis well. This type of analysis only suits high risks investor and whose is willing to throw all the knives above irrespective of any sectoral rotation. BE VERY CAUTIOUS AS IT IS EXTREME BOTTOM FISHING.
HOWEVER, THIS IS HOW MULTIBAGGERS ARE CAUGHT !
STOCK IS AT RIGHT PE / RIGHT EVALUATION / MORE ROAD TO GROW / CORRECTED IV / EXCELLENT BOOKS / USING MARKET CRASH AS AN OPPURTUNITY / EPS AT SKY.
LET'S PUMP IN SOME MONEY AND REVOLUTIONIZE THE NATION'S ECONOMY!
Sharda Cropchem LtdPrice is holding above key support at , forming higher lows and showing strong buying pressure.
A breakout above could confirm upward continuation.
Not financial advice – just sharing my view. 🚀

50 SMA Rising- Positional TradeDisclaimer: I am not a Sebi registered adviser.
This Idea is publish purely for educational purpose only before investing in any stocks please take advise from your financial adviser.
Its 50 SMA Rising Strategy. Suitable for Positional Trading Initial Stop loss lowest of last 2 candles and keep trailing with 50 days SMA if price close below 50 SMA then Exit or be in the trade some time trade can go for several months.
Be Discipline because discipline is the Key to Success in the STOCK Market.
Trade What you see not what you Think
Steel in Uptrend be in Stock

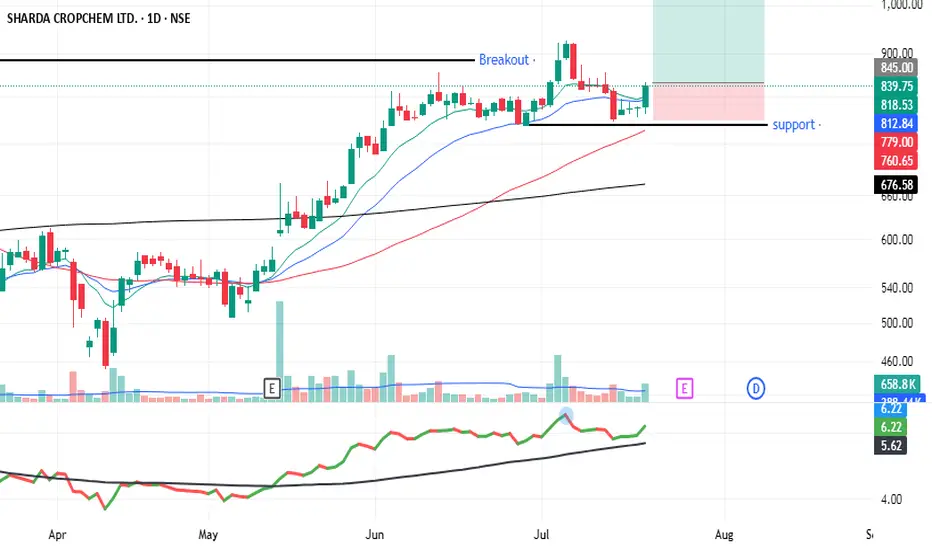
SHARDACROP - Triangle formation on DailySHARDA CROPCHEM LTD on the Daily basis is forming a triangle.
Looking at the volume past few weeks, it looks like break out is inevitable to me.
Plan:
With a Stop loss of below 780 on Daily closing basis, expecting targets 870, 900 and 950. Will revisit once those targets are hit.

SHARDACROP CMP 650.From a long time Chemical sector is consolidating now many chemical stocks are trying for breakout. Sharda Cropchem also from this sector. This stock trading at its 52 week high levels and near its all time high level.Currently at all SMA. On monthly candles volumes are gaining. Stock sign a potential uptrend.Find your best ENTRY EXIT and RISK REWARD area. Thanks.

Sharda Corp Chemicals Ltd view for Intraday 17th October #SHARDASharda Corp Chemicals Ltd view for Intraday 17th October #SHARDACROP
Resistance 610. Watching above 611 for upside movement...
Support area 602-600. Below ignoring upside momentum for intraday
Support 600..Watching below 599 for downside movement...
Resistance area 610....
Above ignoring downside move for intraday
Charts for Educational purposes only.
Please follow strict stop loss and risk reward if you follow the level.
Thanks,
V Trade Point

50 SMA Rising - Positional TradeDisclaimer: I am not a Sebi registered adviser.
This Idea is publish purely for educational purpose only before investing in any stocks please take advise from your financial adviser.
It 50 SMA Rising. Suitable for Positional Trading Initial Stop loss lowest of last 2 candles and keep trailing with 50 days SMA if price close below 50 SMA then Exit or be in the trade some time trade can go for several months.
Be Discipline because discipline is the Key to Success in the STOCK Market.
Trade What you see not what you Think


Sharda crop chemRising from significant levels.
Rising demand of agricultural products.
Flag pattern.

SWING TUTORIAL - SHARDACROPA typical Convergence Divergence is in play here.
Stock is also in a Long term Lower Low Pattern formation.
Could this Convergence Divergence indicate a breakout from the Lower Low Trendline?
Or is the price going to go down further?
Give your comments in the Comments Section below:

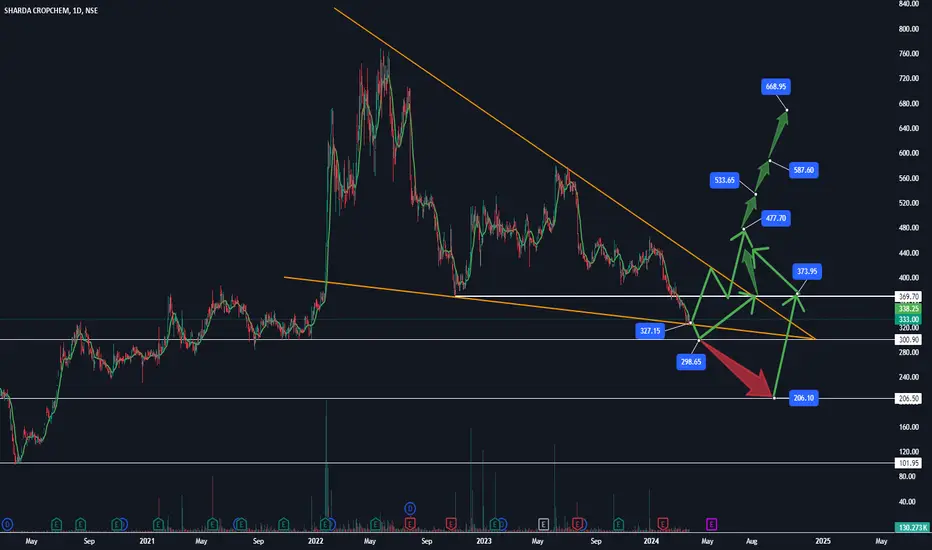
Long term Investment Idea | Sharda Crop | 100% Upside Potential Long term Investment Idea | NSE:SHARDACROP | 100% Upside Potential
✅ Sharda Cropchem CMP - Rs 333
✅ Promoter holding 74.8 %
✅ Company is almost debt free.
✅ Good sales growth over 3-5 years.
✅ Company has good capex and global presence
The negative profit growth observed in companies like UPL, MOL, and Deepak Fertilizers suggests a broader sectoral trend, as similar trends in sales and OPM are evident across all agrochemical stocks.
Valuation is attractive and good to buy/accumulate for Mid to Long term gain from CMP
✅ Add more at Rs 320-300.
The sector is out of flavour and can provide a good contra bet. If good monsoon can further help in earnings.
Targets as per chart drawings.
Thanks
5PercentTrade Trade Ideas - SHARDA CROP#5PercentTrade #Equity #5%Profit_Trade_in_21_Days
Stock Name - NSE:SHARDACROP
Launching our next service of Equity Investment which is designed to give you 5% to 10% return in lest than 21 days via #Equity #Investment.
Trade Process :-
✅ - Buy only at Buy Level as recommended in the chart. Use GTT feature available with all online brokers.
✅ - On successful purchase, immediately create a SL GTT (Stop Loss level asper chart).
✅ - Once Stock Price is at Target 1 level, move your SL to Cost Price or 3% down from Target 1.
✅ - Keep Trailing the SL as Stock Price moves to next Targets.
Share this message to your friends and ask them to join


SHARDA CROPCHEMBounced back from support with good volume and 50 EMA on monthly TF chart. One can long in Sharda Cropchem at CMP.

Support at weekly trend line with volume There has been weekly trend line support. Last week there was volume. Please analyse by yourself for Good to have medium term long. Small stop with red line resistance at Target.

[Basket] Sharda CropChem Buy IdeaNote -
One of the best forms of Price Action is to not try to predict at all. Instead of that, ACT on the price. So, this chart tells at "where" to act in "what direction. Unless it triggers, like, let's say the candle doesn't break the level which says "Buy if it breaks", You should not buy at all.
=======
I use shorthands for my trades.
"Positional" - means You can carry these positions and I do not see sharp volatility ahead. (I tally upcoming events and many small kinds of stuff to my own tiny capacity.)
"Intraday" -means You must close this position at any cost by the end of the day.
"Theta" , "Bounce" , "3BB" or "Entropy" - My own systems.
=======
I won't personally follow any rules. If I "think" (It is never gut feel. It is always some reason.) the trade is wrong, I may take reverse trade. I may carry forward an intraday position. What is meant here - You shouldn't follow me because I may miss updating. You should follow the system I share.
=======
Like -
Always follow a stop loss.
In the case of Intraday trades, it is mostly the "Day's High".
In the case of Positional trades, it is mostly the previous swings.
I do not use Stop Loss most of the time. But I manage my risk with options as I do most of the trades using derivatives.
=======

shardacrop LONGstock maked pol and flag pattern, stock already show breakout with good volume. we can see movement in upcoming days. rsi indicator showing uper movement but uperside have heavy resistance , if price cross overhead resistance then movement coming very fast

A Winning StrategyWith the breakout level which was set at 533 and a subsequent high of 580, we have a solid foundation for success. These levels act as support-turned-resistance zones, offering optimal entry points for a long position.
Manage your risk like a pro with strategic entry and stop-loss points. As per the provided information, consider entering a long position as the stock rebounds from the support level of 533 to 519. Wait for that perfect bounce before diving in.
Protect your investments with a well-placed stop-loss level. For Sharda Cropchem Ltd., we suggest setting the stop-loss at 470 or below. This intelligent move shields you from potential losses and ensures a clear exit if the trade doesn't unfold as anticipated.
A long-term target of 700 levels is within reach. With positive market projections, this stock has the potential to skyrocket. Remember to monitor progress and adjust your target accordingly as market conditions evolve.
9-day Exponential Moving Average (EMA): Short-term momentum gauge. The current 9EMA stands at 538.80, providing confirmation for potential entry points or reversals.
20-day EMA: Broader perspective, acting as an additional confirmation for entry and exit points. Currently at 530.25, it offers valuable insights into the stock's trend.
50-day EMA, 100-day EMA, and 200-day EMA: Long-term views, potential support levels, and guides for adjusting stop-loss or exit points. These moving averages stand at 507.81, 493.32, and 488.96, respectively.

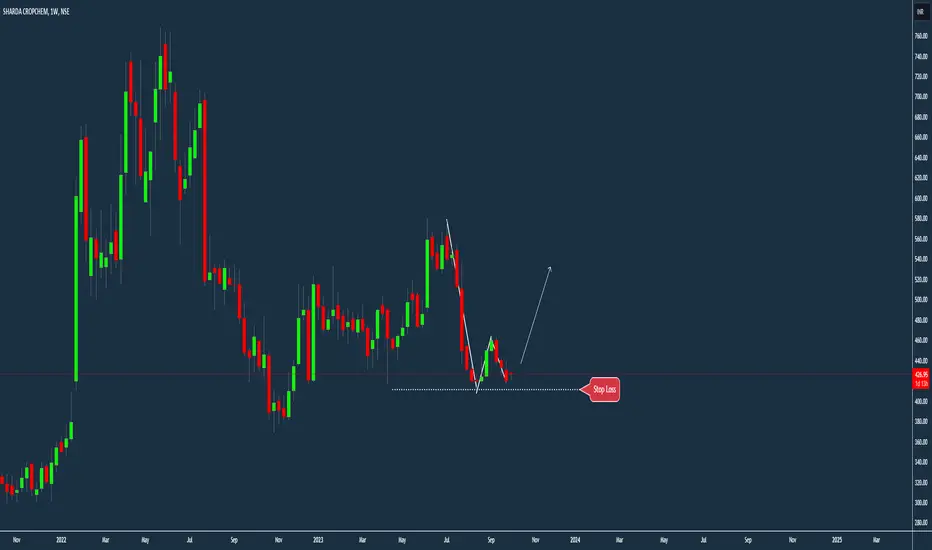
Sharda Corp ViewSharda Corp best for short term swing trade gave BO with high volume and retest also done. Entry 520-530 SL 472 target 596 and 670 with in next 2-6 months.
