buy shree cementslooks good to buy @cmp target 31319.buy at own risks
percentage return approx 4.79%
SHREECEM trade ideas

buy shree cementflag breakout pattern has formed in shree cement. we may witness huge upside till the time it holds 27500. it is advisable to buy in parts

POTENTIAL DIRECTION OF SHREE CEMENTPOTENTIAL DIRECTION OF SHREE CEMENTPOTENTIAL DIRECTION OF SHREE CEMENTPOTENTIAL DIRECTION OF SHREE CEMENTPOTENTIAL DIRECTION OF SHREE CEMENTPOTENTIAL DIRECTION OF SHREE CEMENTPOTENTIAL DIRECTION OF SHREE CEMENTPOTENTIAL DIRECTION OF SHREE CEMENTPOTENTIAL DIRECTION OF SHREE CEMENTPOTENTIAL DIRECTION OF SHREE CEMENTPOTENTIAL DIRECTION OF SHREE CEMENT


Buy Shree CementBullish signal of Parabolic SAR ,Buy at CMP SL 25000 TGT 28000 only for Swing Trading , I am not market expert it's just my prediction.

SHREECEMENTS - Bull Flag + Double Bottom - SwingThe above analysis is done purely on basis of Price Action & Chart Patterns.
The analysis is done on daily TF hence price may take few days to few weeks in order to reach the targets
As can be seen in the image, price has given clear breakout from Bull Flag Pattern with good volume confirmation.
Breakout from Double Bottom pattern is yet to occur.
Entry can be made above the high of breakout candle. SL and Targets are shown in image itself.
The above analysis is purely for educational purpose. Traders must do their own study before entering into any trade. Traders must trade as per their own risk taking capacity and money management.
Feel Free to comment for any queries regarding the above stock or price action analysis in general.
Also check out my other ideas to understand how price action works and how it can be used to make regular profits without any complex strategies.


Go short if open flat or almost flat and cross level Go short if open flat or almost flat and cross level

Go short if open flat or almost flat and cross levelprice taken support multiple times again came for support, If it breaks go for short for target 24201
Note: Price should open flat or almost flat


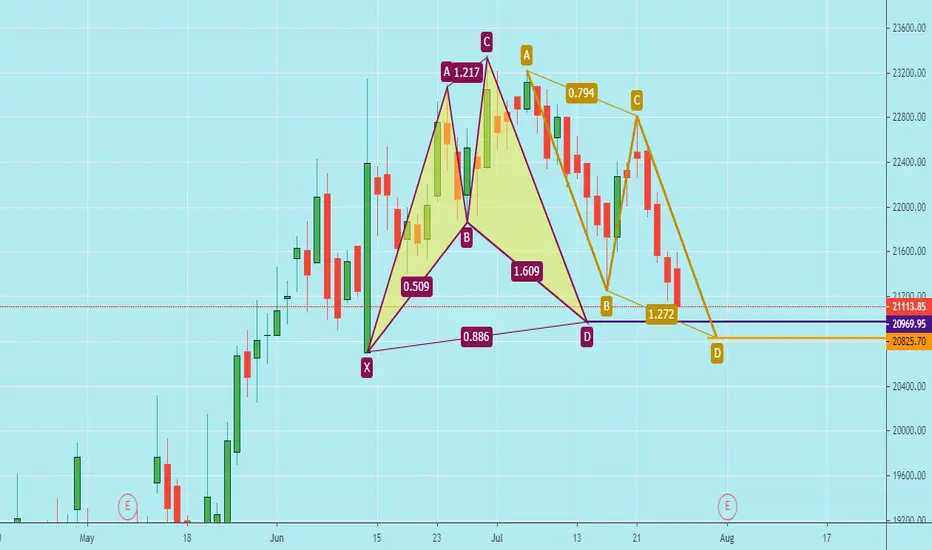
Shree cement head and shoulder pattern formed Shree cement is forming head and shoulders pattern which can fall anytime in the next 1 or maybe 2-3 days
keep shorting opportunities open in shree cement and short near 21200 area and set targets as mentioned in the chart
21200 will act as strong resistance as it has already been rejected at this level previously and also it is a crucial fib level of its major trend
be careful don't short early as shree cement can still go upside till 21200 level to test its resistance zone


Shreecem Monthly/Weekly/Daily/240 min 19250-17831 Shreecem Monthly/Weekly/Daily/240 min 19250-17831
pro:
1. m/w/d/240 co-inciding levels
2. 2 exciting candle 240 min
3. 2 daily exciting candles
4. 25% inside monthly zone origin
con:
1. level over levels, so execution zone in 240 min is fat
2. not much explosive move in execution 240 min
3. origin of the move is other 75% apart from the monthly location zone,, so still more room to go down inside the monthly damnd zone

SHREECEM : 22 AUG 20 : HOW BEAUTIFULLY THIS SUPPORT AND RESISTASHREECEM : 22 AUG 20 :
HOW BEAUTIFULLY THIS SUPPORT
AND RESISTANCE WORK HERE!