Possible shortBelow rising channel looks weak.
Red line is trigger
Rising wedge and support zone confluence zone possible primary tgt.
Here if rising wedge has a breakdown..
Tgt can be even bigger around 2850.
Not a trading advice. Risks and rewards all yours !
SHRIRAMFIN trade ideas

SHRIRAMFINANCE LOOK FOR BUY1. Trend and Moving Averages:
- The stock is in an uptrend with a series of higher highs and higher lows.
- The chart shows two moving averages, 9 and 21-period. The stock is trading above both
moving averages, which confirms the uptrend.
2. Support and Resistance :
- The chart shows a **support line** drawn slightly below the current price, around the 3,177 level. This is a key area to watch as it has acted as a floor for the stock previously.
- There are also dashed lines indicating resistance levels above the current price, suggesting that the stock may face some resistance around those levels.
3. Volume :
- The volume bars at the bottom indicate that there is reasonable trading activity. Higher volumes on up days generally support the bullish momentum, but you should also watch for any significant increases in volume on down days as they might signal distribution or a potential reversal.
4. Candlestick Patterns :
- The recent candlesticks suggest a consolidation phase after a strong move up which is base on base structure. This is typical after a sharp rise where the stock may need to digest the gains before attempting another leg higher.
5. Overall :
- The stock appears to be in a healthy uptrend with defined support. The consolidation phase near the highs suggests that the market is digesting recent gains. A breakout above the resistance could lead to further upside, while a break below the support level might indicate a pullback or trend reversal.

Shriram Finance-Bullish Swing- Chance of breakout!! NSE:SHRIRAMFIN
01.08.2024
Buy 2987
Target 3137
Stop Loss 2837
Risk :Reward- 1:1
1. Inside bar breakout
2. Very good retracement after consolidation breakout.
3. Resistance turned to support zone
at 0.382 Fibonacci
4. Reducing volumes in bearish candles and
good volumes in breakout candle
5. Price failed to reach support after creating double top

SHRIRAM FINANCE LTD S/R Support and Resistance Levels:
Support Levels: These are price points (green line/share) where a downward trend may be halted due to a concentration of buying interest. Imagine them as a safety net where buyers step in, preventing further decline.
Resistance Levels: Conversely, resistance levels (red line/shade) are where upward trends might stall due to increased selling interest. They act like a ceiling where sellers come in to push prices down.
Breakouts:
Bullish Breakout: When the price moves above resistance, it often indicates strong buying interest and the potential for a continued uptrend. Traders may view this as a signal to buy or hold.
Bearish Breakout: When the price falls below support, it can signal strong selling interest and the potential for a continued downtrend. Traders might see this as a cue to sell or avoid buying.
20 EMA (Exponential Moving Average):
Above 20 EMA: If the stock price is above the 20 EMA, it suggests a potential uptrend or bullish momentum.
Below 20 EMA: If the stock price is below the 20 EMA, it indicates a potential downtrend or bearish momentum.
Trendline: A trendline is a straight line drawn on a chart to represent the general direction of a data point set.
Uptrend Line: Drawn by connecting the lows in an upward trend. Indicates that the price is moving higher over time. Acts as a support level, where prices tend to bounce upward.
Downtrend Line: Drawn by connecting the highs in a downward trend. Indicates that the price is moving lower over time. It acts as a resistance level, where prices tend to drop.
RSI: RSI readings greater than the 70 level are overbought territory, and RSI readings lower than the 30 level are considered oversold territory.
Combining RSI with Support and Resistance:
Support Level: This is a price level where a stock tends to find buying interest, preventing it from falling further. If RSI is showing an oversold condition (below 30) and the price is near or at a strong support level, it could be a good buy signal.
Resistance Level: This is a price level where a stock tends to find selling interest, preventing it from rising further. If RSI is showing an overbought condition (above 70) and the price is near or at a strong resistance level, it could be a signal to sell or short the asset.
Disclaimer:
I am not a SEBI registered. The information provided here is for learning purposes only and should not be interpreted as financial advice. Consider the broader market context and consult with a qualified financial advisor before making investment decisions.

short term targetwell-known company
good fund mental
breakout chart
run away gap in today sesion
bulish candle

SHRIRAMFIN | SWING | LONGCreating a nice base near highs
Volume contraction
Negative:
EMA's Flatting which means the price is lacks momentum
Caution:
Overall market conditions are highly volatile which can impact the trade idea

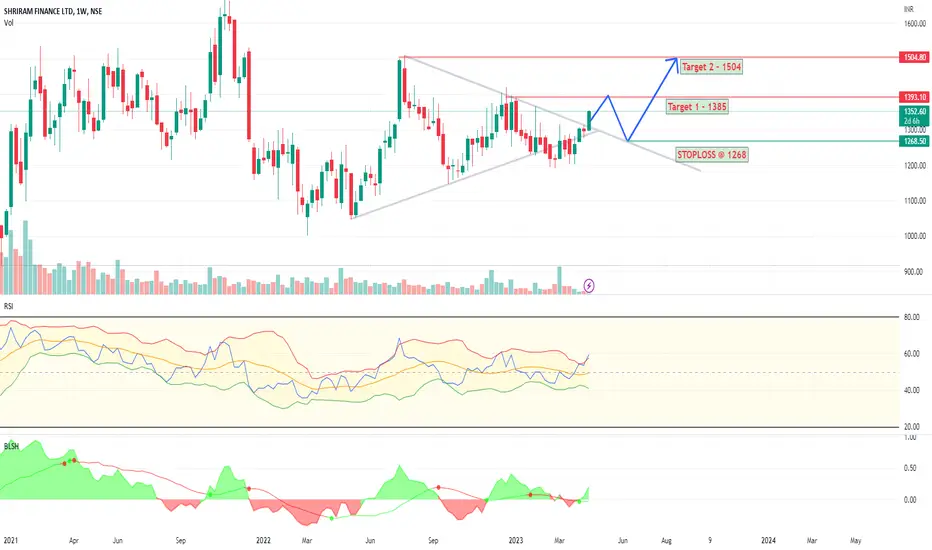
Shriram Finance: Bullish Flag Signals Further GainsShriram Finance Ltd.'s recent price action presents a classic bullish flag pattern, indicating a potential continuation of the upward trend. This pattern, characterized by a sharp rise followed by a brief consolidatory period, suggests that the stock could be gearing up for another leg higher. Traders should monitor for a breakout above the consolidation zone as a confirmation of bullish momentum, which could offer a favorable opportunity for long positions. This setup offers a strategic point for traders to capitalize on the underlying strength of Shriram Finance.

Ascending triangle pattern on SHRIRAMFINSHRIRAMFIN formed an ascending triangle pattern on daily chart and broke out of the pattern today. With multiple support and resistance tested, appears to be a bullish breakout. Stoploss can be held just below the breakout candle with target the size of broader edge of triangle. You could trail stop loss with either 2 ATR (Average True Range) or 10 EMA (Exponential Moving Average).
Hope you like this analysis. Please boost this idea if you like it or leave a comment below on what you think. Otherwise happy trading :-)

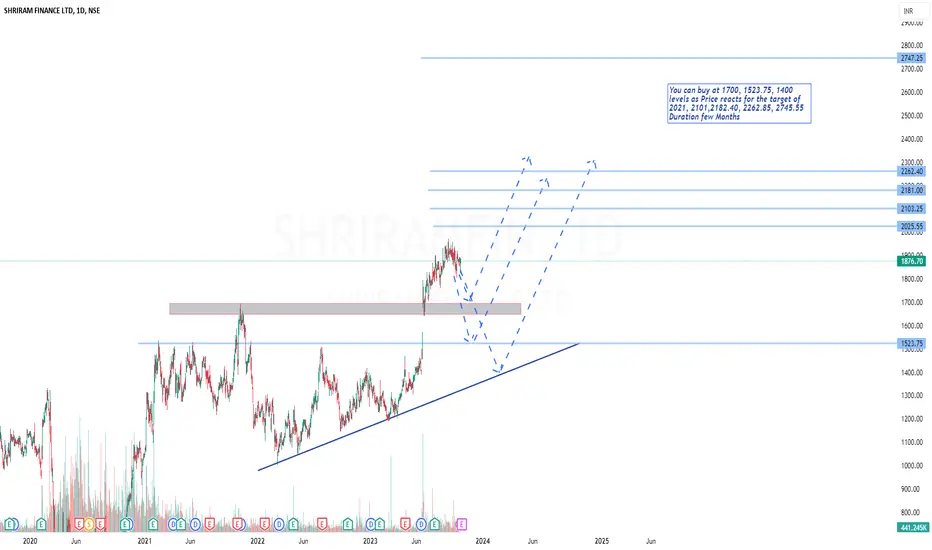
Positional setup for Shriram fin You can buy at 1700, 1523.75, 1400 levels as Price reacts for the target of 2021, 2101,2182.40, 2262.85, 2745.55
Duration few Months
Trade Idea in Shri ram finance 👋 Hey there! Ready to dive into the trading game? I'm your go-to Technical Analyst for some cool trade observations and trading wisdom. Just a heads up, my recommendations are all about learning and watching – no pressure to jump in. Let's break down those charts and turn them into some savvy trading know-how. Ready for a laid-back but enlightening journey through the markets? Let's do it! 📈✨
NSE:SHRIRAMFIN

SHRIRAMFIN - Stock AnalysisShriram Finance Ltd. presents a strong technical and fundamental profile, making it an attractive option for investors.
From a technical perspective, the stock exhibits numerous "Strong Bullish" signals. The one-day analysis is "Bullish," with the latest tick indicating a strong price rise. The KeltnerBand suggests "Strong Bullish" sentiment with a positive breakout pattern. The MACD (Moving Average Convergence Divergence) is "Strong Bullish," displaying a bullish crossover of the Macd and Signal lines, as well as a zero-line crossover, indicating a positive trend.
The Awesome Oscillator is "Bullish," showing a bullish reversal with the Awesome Oscillator crossing above zero. The MAChannelBand and Bollinger Bands both exhibit "Strong Bullish" signals with positive breakout patterns. The Supertrend is "Bullish" with a bullish crossover, and the ADX (Average Directional Index) is "Bullish," trending upward. The HighLowMABand also indicates "Strong Bullish" sentiment with a positive breakout pattern.
Candlestick patterns on the daily, weekly, and monthly charts are "Bullish," suggesting positive sentiment. In the weekly candlestick pattern, a "Three Outside Up" pattern has formed at a recent low level, indicating the possibility of a good bullish reversal.
In terms of resistance and support, the stock has encountered short-term and medium-term resistance levels, with top points at 1954.85 on November 2, 2023, 1921.95 on October 3, 2023, 1957.2 on September 11, 2023, and 1928.3 on August 31, 2023. Additionally, there are short-term support lines with bottom points at 1797.6 on October 26, 2023, 1820.9 on October 9, 2023, 1796.0 on August 16, 2023, and 1782.85 on July 20, 2023.
From a fundamental perspective, Shriram Finance Ltd. appears undervalued with a Price to Earnings Ratio of 10.08 and an EV to EBITDA ratio of 7.71, suggesting that the company's stock may be trading at a discount to its intrinsic value.
The company has demonstrated significant growth in its Book Value over the last three years, indicating a strong financial position. Shriram Finance Ltd. offers an Earning Yield of 9.92% and all key Trailing Twelve Months Margins have grown by 15%. The Piotroski F Score is at a stable value of 4.0, signifying sound financial health.
Annual net profit has been trending upward over the last three years, and EBITDA has continuously increased for the past three years. The company also maintains a good Return on Equity of 17.36% and a strong Net Margin of 19.95%.
Despite this, the company has given poor Returns on Assets in the last three years, which is an aspect to monitor. However, there is a short-term positive trend in total sales and net profit, with a strong jump in net sales in terms of year-over-year (YoY) growth. The company has achieved annual sales growth for three consecutive years, and quarterly sales over the last five years are trending upward. Additionally, the debt-to-equity ratio has decreased and is at its lowest level in the last five years.
In conclusion, Shriram Finance Ltd. presents a compelling investment opportunity with strong technical and fundamental indicators. The stock's bullish technical signals, coupled with its undervaluation and strong financial performance, make it an attractive choice for investors seeking potential growth and value in the market. Nevertheless, investors should remain vigilant and monitor both technical and fundamental developments for a comprehensive understanding of the stock's potential.
Go Long above 1965
Stop Loss 1809


Swing Buy opportunity in Shriram FinanceRefer the chart for Entry,Target and SL.
NOTE: This trade is only for Equity Swing buy and not to be considered for options trading.
Please do follow Position Sizing and Risk Reward Ratio while planning any trades.
Note: This information is for education purpose only and please do your own research and consult your financial advisor prior to taking any action.
TO CONNECT WITH ME CHECK OUT MY BIO.
If you like this Idea, Please do like my ideas and share it with your friends. check my bio.
Please boost my ideas and send cheers as it acts as a motivation to keep posting my analysis.
Thank you

SHRIRAMFIN 1d time frame ascending triangle breakdownSHRIRAMFIN 1d time frame
ascending triangle breakdown
risk reward 1.5
it just a view trade @ your own risk
sl@1877

ASCENDING CHANNEL BREAKOUTAscending channel pattern was formed on SHRIRAMFINANCE breakout has been done.
Now it's time for bearish move.
Expected Targets are:
TP1 - 1759
TP2 - 1710
TP3 - 1654

SHRIRAM FINANCE Shriram Transport Finance Company Ltd is a part of the SHRIRAM Group conglomerate which has a significant presence in the financing business. STFC is engaged in the business of commercial vehicle financing mainly focusing on trucks from preowned to new ones. It's a Deposit-taking NBFC comprising 1,758 branches, 831 rural centers, and partnerships with ~500 private financiers.
Targets and and stop loss given in the chart
Market Cap
₹ 50,604 Cr.
Current Price
₹ 1,352
High / Low
₹ 1,509 / 1,047
Stock P/E
9.30
Book Value
₹ 748
Dividend Yield
1.48 %
ROCE
9.90 %
ROE
11.4 %
Face Value
₹ 10.0
Promoter holding
25.3 %
EPS last year
₹ 101
EPS latest quarter
₹ 48.0
Debt
₹ 1,25,951 Cr.
Pledged percentage
0.00 %
Net CF
₹ -388 Cr.
Price to Cash Flow
-5.71
Free Cash Flow
₹ -8,893 Cr.
Debt to equity
4.49
OPM last year
69.8 %
OPM 5Year
72.2 %
Reserves
₹ 27,752 Cr.
Price to book value
1.81
Int Coverage
1.63
PEG Ratio
0.56

Srtransfin_10.06.2023Short chance. May have strong resistance. If broken, can rise. For educational purpose only.

SHRIRAMFINANCE--Bullish or Bearish ??Observations::
the stock broken the trendline in Daily timeframe strongly, and tested the resistance.
the previous resistance is acts as a support and price moved up again, testing the resistance one more time and now its again at the support.
---------->> If this time @ support showing some bullish pressure, if this will continue price will break the resistance easily, and creates a new high.
--------->> we have a previous resistance @ 1500 range, this time it will test this range.
--------->> If price breaks 1300 range and support acts as resistance price falls below level of support @ 1200 range and below.
we have a trendline in smaller time frame as well, if breaks & retest will observe bullishness. Keep track this instrument.

SHRI RAM TRANSPORT BREAK OUTYellow Triangle is the accumulation zone..
Breakout above the red line..
Blue Line is buying at the bottom..
Green Line is very Strong historical Support.. SL to be Placed below that..
Dotted Red line is the top level resistance.. Some profit booking can be done at that level for swing trading..

Shriram finanace ltd. I think this stock going up
This stock cross all the moving averages and going up for this laveles

Shriram Finance for targets of 1800Shriram finance is in consolidation since Nov'2021.Stock seems to have completed its consolidation phase and now looking good for targets for 1800.stop below 1300.

