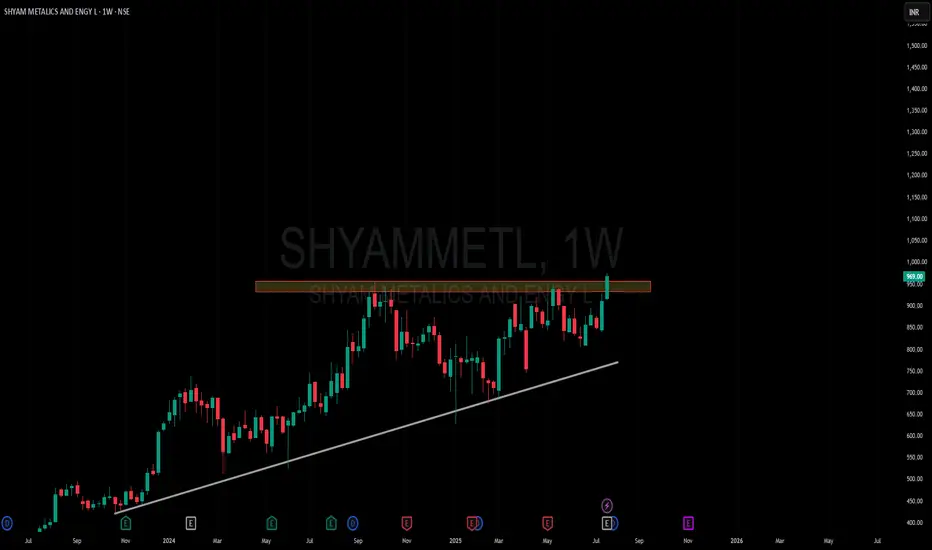
Amazing breakout on WEEKLY Timeframe - SHYAMMETLCheckout an amazing breakout happened in the stock in Weekly timeframe, macroscopically seen in Daily timeframe. Having a great favor that the stock might be bullish expecting a staggering returns of minimum 25% TGT. IMPORTANT BREAKOUT LEVELS ARE ALWAYS RESPECTED!
NOTE for learners: Place the breakout levels as per the chart shared and track it yourself to get amazed!!
#No complicated chart patterns
#No big big indicators
#No Excel sheet or number magics
TRADE IDEA: WAIT FOR THE STOCK TO BREAKOUT IN WEEKLY TIMEFRAME ABOVE THIS LEVEL.
Checkout an amazing breakout happened in the stock in Weekly timeframe.
Breakouts happening in longer timeframe is way more powerful than the breakouts seen in Daily timeframe. You can blindly invest once the weekly candle closes above the breakout line and stay invested forever. Also these stocks breakouts are lifelong predictions, it means technically these breakouts happen giving more returns in the longer runs. Hence, even when the scrip makes a loss of 10% / 20% / 30% / 50%, the stock will regain and turn around. Once they again enter the same breakout level, they will flyyyyyyyyyyyy like a ROCKET if held in the portfolio in the longer run.
Time makes money, GREEDY & EGO will not make money.
Also, magically these breakouts tend to prove that the companies turn around and fundamentally becoming strong. Also the magic happens when more diversification is done in various sectors under various scripts with equal money invested in each N500 scripts.
The real deal is when to purchase and where to purchase the stock. That is where Breakout study comes into play.
Check this stock which has made an all time low and high chances that it makes a "V" shaped recovery.
> Taking support at last years support or breakout level
> High chances that it reverses from this point.
> Volume dried up badly in last few months / days.
> Very high suspicion based analysis and not based on chart patterns / candle patterns deeply.
> VALUABLE STOCK AVAILABLE AT A DISCOUNTED PRICE
> OPPURTUNITY TO ACCUMULATE ADEQUATE QUANTITY
> MARKET AFTER A CORRECTION / PANIC FALL TO MAKE GOOD INVESTMENT
DISCLAIMER : This is just for educational purpose. This type of analysis is equivalent to catching a falling knife. If you are a warrior, you throw all the knives back else you will be sorrow if it hits SL. Make sure to do your analysis well. This type of analysis only suits high risks investor and whose is willing to throw all the knives above irrespective of any sectoral rotation. BE VERY CAUTIOUS AS IT IS EXTREME BOTTOM FISHING.
HOWEVER, THIS IS HOW MULTIBAGGERS ARE CAUGHT !
STOCK IS AT RIGHT PE / RIGHT EVALUATION / MORE ROAD TO GROW / CORRECTED IV / EXCELLENT BOOKS / USING MARKET CRASH AS AN OPPURTUNITY / EPS AT SKY.
LET'S PUMP IN SOME MONEY AND REVOLUTIONIZE THE NATION'S ECONOMY!
SHYAMMETL trade ideas
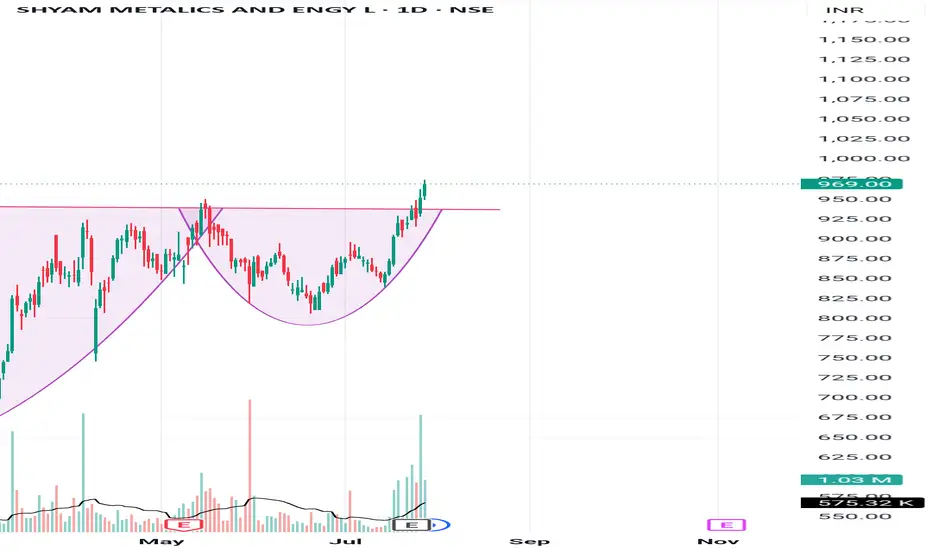
Cup and handle patternBreaks cup and handle pattern and going up. Looks bullish. Make sure to do your own analysis and maintain your risk management. This is only for educational purposes
bullish for long time now a monthly break outI dont give clear sl due to the holding period , the targets wont justify the sl and so the ideal sl is 7% for me but target can be 12-20%

SHYAM METALICS – Breakout Zone Alert Price is approaching a key resistance zone (~₹950) after breaking out of a descending channel with strong volume and RSI confirmation.
This setup indicates potential bullish continuation.
📌 Trade Plan:
Buy above ₹955
Stoploss: ₹915
Target 1: ₹1,010
Target 2: ₹1,065
Sell below: ₹915 (only if price rejects resistance with volume)
Reasoning:
Price broke long-term downtrend
Strong volume and RSI > 60
Clean resistance breakout in sight
For Education Purposes Only

SHYAMMETLSHYAMMETL giving cup & handle breakout with decent increased volume. It is showing strength after recent fall. Now it it sustains above 958 then it may take a fresh ride from hereon. It may take a ride up to 25-27%. Closing below 890 may change my view for it.

Trend is our friend Trendline breakout stockAfter 6 months trendline breakout
50% Momentum is there in this stock as per technical Analysis
take entry with your own technical analysis

SHYAM METALICS AND ENGY LTD Support and Resistance Levels:
Support Levels: These are price points (green line/shade) where a downward trend may be halted due to a concentration of buying interest. Imagine them as a safety net where buyers step in, preventing further decline.
Resistance Levels: Conversely, resistance levels (red line/shade) are where upward trends might stall due to increased selling interest. They act like a ceiling where sellers come in to push prices down.
Breakouts:
Bullish Breakout: When the price moves above resistance, it often indicates strong buying interest and the potential for a continued uptrend. Traders may view this as a signal to buy or hold.
Bearish Breakout: When the price falls below support, it can signal strong selling interest and the potential for a continued downtrend. Traders might see this as a cue to sell or avoid buying.
MA Ribbon (EMA 20, EMA 50, EMA 100, EMA 200) :
Above EMA: If the stock price is above the EMA, it suggests a potential uptrend or bullish momentum.
Below EMA: If the stock price is below the EMA, it indicates a potential downtrend or bearish momentum.
Trendline: A trendline is a straight line drawn on a chart to represent the general direction of a data point set.
Uptrend Line: Drawn by connecting the lows in an upward trend. Indicates that the price is moving higher over time. Acts as a support level, where prices tend to bounce upward.
Downtrend Line: Drawn by connecting the highs in a downward trend. Indicates that the price is moving lower over time. It acts as a resistance level, where prices tend to drop.
Disclaimer:
I am not a SEBI registered. The information provided here is for learning purposes only and should not be interpreted as financial advice. Consider the broader market context and consult with a qualified financial advisor before making investment decisions.

Shyam MetallicsShyam metallics is making a hh/hl structure, script in uptrend with potential of making a new high!

#Shyam Metalics And Energy LtdShyam Metalics And Energy Ltd Breakout Symmetrical Triangle Pattern
Buy - Above 870
Stop Loss - 775
Target - 946 and 1050

Long in SHYAM Metallics1.Good DNA (12-18%)
2. Uptrend, Formed U shape after huge move
3. Good green bars with volumes
4. Good contraction with low volume
5. Best chart pattern compared to peers

Shyam Metalics & Energy Ltd.*Shyam Metalics & Energy Ltd*
P&F Formation on Yearly Basis.
Strong Price BreakOut & Sustained.
Continue Vol. Traction.
RSI: All in Bullish Zone across TFs.
EMAs: Widening Gaps amongst 20/ 50/ 100/ 200 levels on Monthly Basis.
*Trail SL with Upside*
*Book Profit as per Risk Appetite*
Sound financials with growing Top/bottom lines on Qrtly / Yrly basis. Stable Profitability margins. Low leverage, substantial TNW.
Continued stable Promoter stake.
*Do your own research as well. This is an Opinion.*
*_Happy Investing_*🤓

SHYAMMETL | BASE NEAR ATH | SWINGMaking a base near ATH
High Momentum
Might give out a breakout in upcoming days

Darvas Box Breakout 13.08.2024Darvas Breakout - As per Darvas Breakout theory stock has given break out keep under watch list
I am not a Sebi registered adviser.
This Idea is publish purely for educational purpose only before investing in any stocks please take advise from your financial adviser.

SHYAMMETL NSE:SHYAMMETL
Formaing C & H pattern
good upside is possible if sustain above 720
Target will 790 & 900 in short term.
RSI>60
volume is increasing in last 3days
swing trade


SHYAMMAT📢breakout stock📢
🫸 Wait for the Retest 🫷
These are swing ideas which you can add your watchlist and analysis for yourself !
Keep on your radar!
This content only education purpose!
❗I am not sebi ragister❗
SHYAMMETLStock has given a range breakout with good volumes. Wait for a pullback for entry
Note- Trade as per your analysis

Metal is ready for boomBreakout trading implementation:
1. **Identifying New Trends:** Breakout trading helps traders identify the beginning of new trends by focusing on price levels where an asset breaks out of its historical trading range.
2. **Volatility Indicator:** Breakouts often occur when there's increased volatility in the market. Monitoring breakouts can provide insights into shifts in market sentiment and potential price movements.
3. **Entry Points:** Breakout points serve as potential entry points for traders looking to ride the momentum of a newly established trend. Buying on a breakout can capture the early stages of a price movement.
4. **Confirmation of Strength:** Successful breakouts indicate the strength of a trend. If an asset breaks out with high volume and follows through with sustained price movement, it suggests a strong trend in that direction.
5. **Avoiding False Signals:** Breakout strategies often include using indicators or confirmation signals to avoid false breakouts. This can enhance the accuracy of trade decisions.
6. **Defined Risk and Reward:** Breakout trading allows for setting clear stop-loss levels below the breakout point, which helps manage risk. Traders can also calculate potential profits based on the distance between the breakout point and a projected target.
7. **Adaptable to Various Markets:** Breakout trading can be applied to various markets, including stocks, forex, commodities, and cryptocurrencies. The concept remains consistent across different assets.
8. **Flexibility:** Traders can adapt breakout strategies to their preferred timeframes, whether they are day traders, swing traders, or long-term investors.
9. **Liquidity Opportunities:** Breakout points are often associated with increased trading volume, which can provide better liquidity for executing trades.
10. **Risk vs. Reward Assessment:** Traders can evaluate the potential risk of a trade (stop-loss) against the potential reward (target price), aiding in decision-making and portfolio management.
11. **Psychological Advantage:** Successful breakout trades can boost a trader's confidence and discipline, reinforcing the effectiveness of their strategy.
12. **Market Events:** Breakouts can occur around significant market events such as earnings reports, economic data releases, or geopolitical developments, offering traders opportunities to capitalize on sudden price movements.
Remember, while breakout trading offers potential advantages, it also carries risks. False breakouts and market reversals can lead to losses. Successful implementation requires a solid understanding of technical analysis, risk management, and the ability to adapt to changing market conditions.

#Shyam Metalicstrading above life time high
weekly inside candles showing a pause. above this will blast
look volume spread
Roaring Lion
enter above previous week high and Keep The Sl below this week

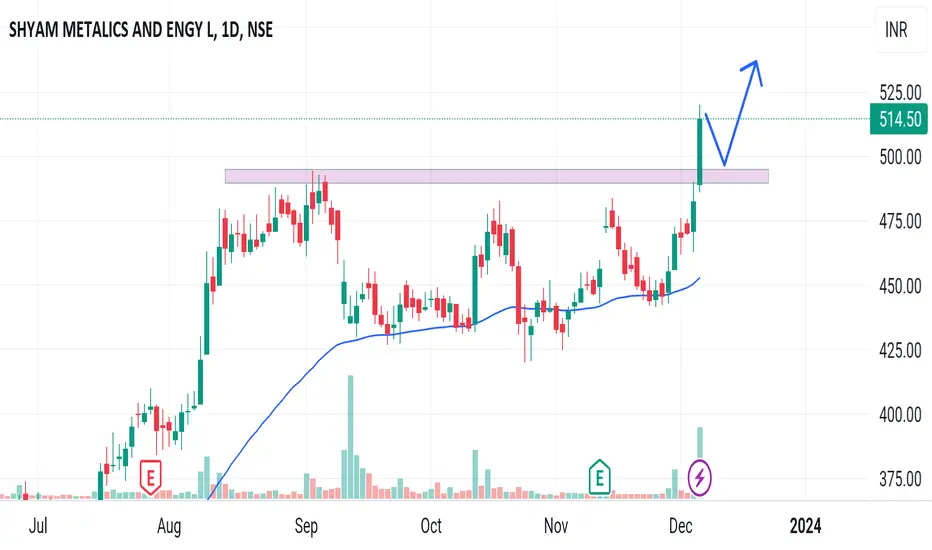
Shyam Mettalics-Nice BreakoutShyam Mettalics-Nice Breakout
Capital to be deployed- 20k
Investing Price -375-377
Breakout Price -375
Stoploss -344
Targets - 442-527
#shyammettalics #StockMarketindia #StockToWatch #StocksInFocus #stockstowatch #StocksToTrade

Shyam MetallicsAgain from Metal sector, Looks good above 340 levels as marked in the chart.
Indicators show strength in all the time frames

A SHARE RELATED TECHNO AND FUNDA ANALYSISLooking of the recent price action and chart analysis this share looks like we making good profit
we will get around 50% profit
I'M buying shares worth Rs.100000 one can buy it with stop loss of 280 on daily basis
This company expand itself rapidly this also become multibagger
Currently i'm taking 6-12 month hold

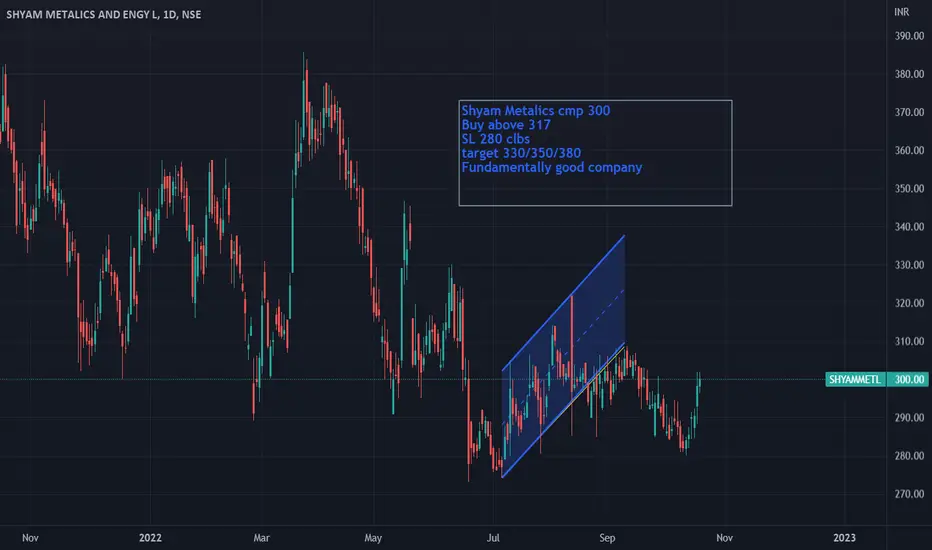
#ShyamMetalicsShyam Metalics cmp 300
Buy above 317
SL 280 clbs
target 330/350/380
Swing trading
Fundamentally good company