SIGACHI trade ideas
Sigachi Industries Ltd - Special Situation Explosion at the Sigachi Industries' pharma plant in Pashamylaram, Telangana
I feel company fundamentals are good. Explosion at the Sigachi would be the opportunity to get in the good stock at lower level, as there are some damage due to explosion, we need to stick on stop loses.
Sigachi Industries Ltd. engages in the manufacture and sale of microcrystalline cellulose. Its product is used as an excipient for finished dosages in the pharmaceutical, food, nutraceuticals, and cosmetic industries, as a stabilizer, anti-caking agent, fat substitute, and emulsifier in food industry
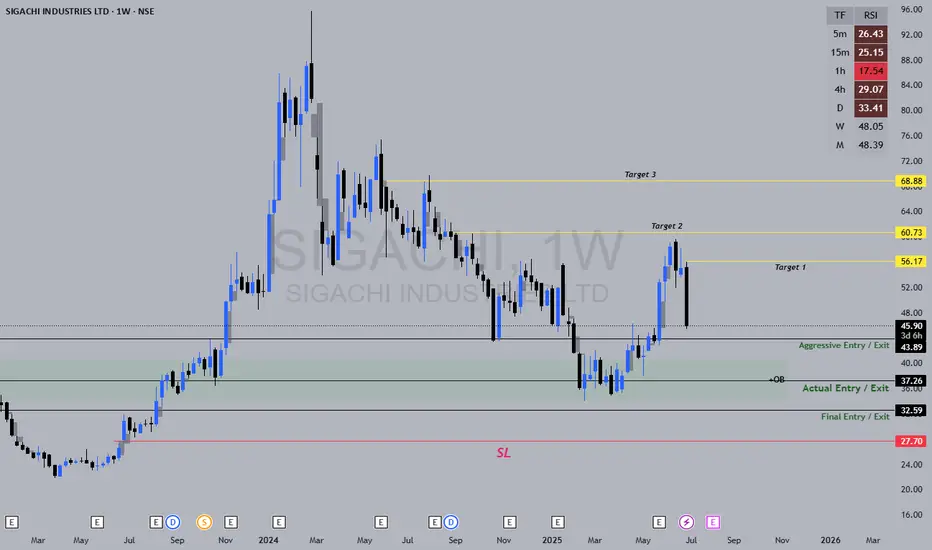
SIGACHISIGACHI, watch above levels. redline is our SL.
DISCLAIMER : I am NOT a SEBI registered advisor or a financial adviser. All the views are for educational purpose only.

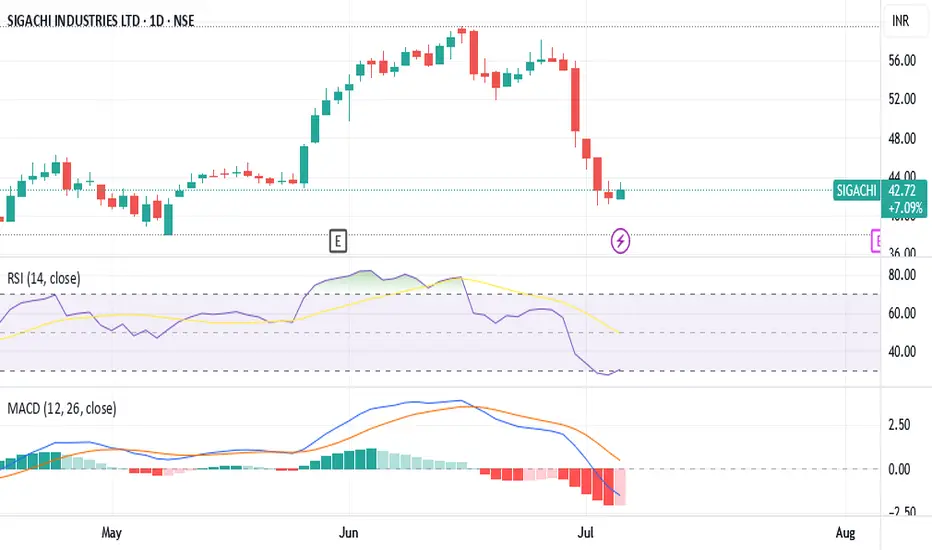
SIGACHIHi guys,
In this chart i Found a Demand Zone in SIGACHI CHART for Positional entry,
Observed these Levels based on price action and Demand & Supply.
*Don't Take any trades based on this Picture.
... because this chart is for educational purpose only not for Buy or Sell Recommendation..
Thank you

SIGACHI Industry IPO based strategy
Round bottom pattern
RSI above 60 daily / weekly / Monthly
moving averages in line 21/50/200

SIGACHI IS TOOOO BULLISHsigach ind. has formed a great rounding botton or cup and handle pattern in weekly TF and also broke the all time high and the IPO LISTING price and now ready to touch new highs

SIGACHI : Reversal from Major support SIGACHI reversing from Major support. R:R is wonderful here. study at your end and share your view

#Large Rounding bottom near breakout also facing Monthly Supply This is Sugachi Monthly Chart making large rounding botton with excellent monthly volume.Now stock is near resistance n in Supply Zone .Stock needed to breakout Rs 52 to regain Momentum

SIGACHI Double bottom break out in sigachi. Buy in this price range SL 326 or Break out candle low. as per your risk reward ratio.
Break out supported by gud volume and 20 MA.
Target will be huge in this trade. As stock is down by 40% From ATH.
next 5 months will be in this trade.

Sigachi Industries Appearing strong after surpassing both the Gann levels and a significant long-term resistance point at 396.7.
Additionally, the Gann fann angle 1/1has been successfully retested.
The short-term target for scalping is 410, where another long-term resistance level is present, suggesting potential consolidation.
However, there's a possibility of reaching 437 in the near future.

bullish on SiggachiBest buy above 401 on wclbs with Stoploss 345.
Target minimum 568.
RRR 1:3
forming rounding bottom pattern expected C&H pattern.
only for Educational Purpose


Sigachi Industries Coming out of the consolidation zone of 1 yr with good volumes.
We can expect a targets of 450-500 in this small cap chemical sector stock. Fundamentals are also good generating increasing net profit annually.

Sigachi industries CMP 237Long term view.
Sigachi is market leader in MMC
Hold for long term , Avaliable at low price

Sigachi Industries LimitedAfter listing the stock has almost corrected 68.29% from its listing price and started consolidating in a tight range. The stock has already given breakout of its triangle pattern on weekly timeframe. The next immediate resistance for the stock is 330 Rs if the stock takes out this level then me might see a strong upside move in the stock in coming trading sections.
What's your thought on sigachi industries let me know in the comment sections


Sigachi IndsutryTechnical breakout in sigachi industry with good volume(more than the average of 50 days)
Buy above 280-282 Tgt 290+
SL 276

Classic Chart Pattern.Sigachi is forming beautiful setup, keep an eye could give breakout, and it is near 200 EMA

SIGACHI - BREAKOUT IS INEVITABLEAdd near 280 278 zones on pullback...Target 340 380 in coming months.

SIGACHI TARGET 332.50High resistance will be broken and next reach long till 332.50 hold it.
Rsi cross 70 good
Macd is positive
Volume are high shows high trading activity

SIGACHI INDUSTRIES SHARES TARGET Predictions
Rsi crossed 1 day chart >50 bullish test higher than rsi ma
Predicted fresh breakout of engulfing candle
Strong breakout of resistance
Target range 260 till 289
11% after that can trail SL
NSE:SIGACHI

SIGACHI broke falling wedge pattern Siggachi broke falling wedge pattern with positive divergence in RSI now its seems in bullish mode for longer term
