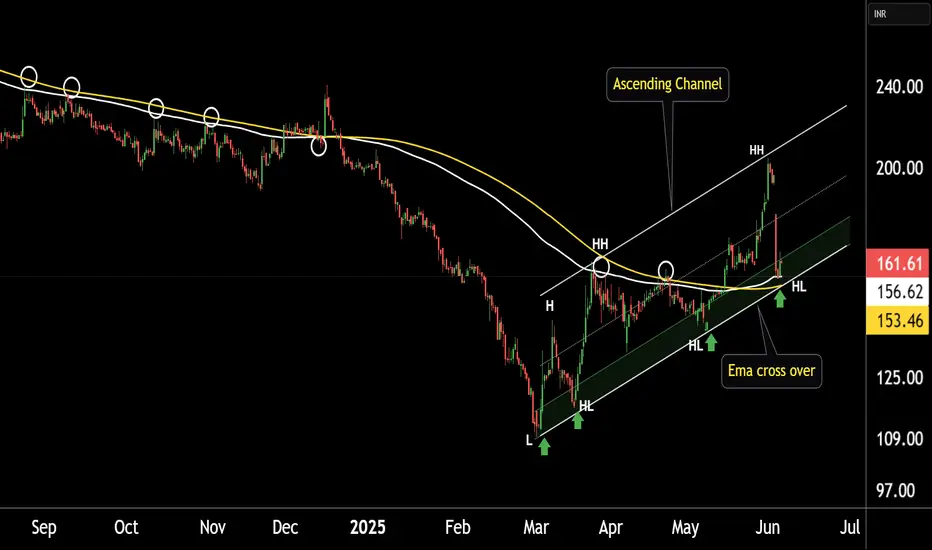
SPARC This is the 4 hour chart of SPARC.
SPARC is currently trading near the support boundary of an ascending channel at 150-155 range.
SPARC has given a positive EMA crossover at price 152-156 range
If this level sustain, we may see higher price in the SPARC.
Thank You !!
SPARC trade ideas
Trendline Breakout - SPARCCurrent Price: ₹169.82
Technical Analysis:
Trendline Breakout Pattern: This is a bullish technical signal. A breakout from a trendline, especially if it was a resistance trendline, suggests that the stock has overcome a significant hurdle and is likely to move higher. For confirmation, it's ideal to see the breakout accompanied by strong trading volume.
Immediate Target: ₹233
Time Frame: 3 to 6 months (This suggests a medium-term horizon for achieving the target).
Fundamental Analysis:
Company Overview: SPARC is a pharmaceutical company engaged in research and development. It's important to note that R&D-focused companies often have different financial profiles compared to established, revenue-generating pharmaceutical companies. They typically have lower or even negative profits in the short term as they invest heavily in developing new drugs and technologies.
Quarterly Results (Q4 FY25 - ended March 31, 2025):
SPARC often reports losses due to its R&D heavy nature. For Q4 FY25, the company reported a consolidated net loss of ₹90.3 crore, higher than the loss of ₹60.8 crore in Q4 FY24.
Revenue from operations also declined to ₹40.5 crore in Q4 FY25 from ₹51.4 crore in Q4 FY24.
Yearly Results (FY25 - ended March 31, 2025):
For the full fiscal year FY25, SPARC reported a consolidated net loss of ₹363.8 crore, significantly higher than the loss of ₹237.3 crore in FY24.
Revenue from operations for FY25 also decreased to ₹182.2 crore from ₹236.8 crore in FY24.
P/E Ratio: Given that SPARC often reports losses, its P/E ratio is typically not applicable (N/A) or negative, as a P/E ratio requires positive earnings. Investors usually evaluate such companies based on factors like pipeline progress, clinical trial results, regulatory approvals, and potential market size of their innovations rather than traditional profitability metrics.
EPS Comparison: As the company is often in a loss-making phase due to R&D expenses, the EPS is typically negative. Comparing negative EPS values can be less insightful than tracking the progress of their drug pipeline.
Corporate Actions:
Dividend: SPARC typically does not pay dividends given its R&D phase and often negative profitability.
Funding/Partnerships: Key corporate actions for SPARC would include fundraising rounds, strategic partnerships for drug development or commercialization, and announcements related to regulatory approvals or clinical trial successes.
Company Order Book:
SPARC, being an R&D company, generally does not have a traditional "order book" like manufacturing or infrastructure companies. Its future revenue visibility depends on successful drug development, licensing agreements, or commercialization of its patented products.
Latest News:
Q4 and FY25 Results: The latest news would likely focus on the company's increased losses and decreased revenue, along with management commentary on the progress of their various drug candidates in clinical trials.
Clinical Trial Updates: Any announcements regarding the phases of clinical trials (Phase I, II, III), interim results, or regulatory submissions for its drug pipeline would be significant news.
Research & Development: Updates on new research areas or technological advancements.
Overall Assessment:
SPARC presents a challenging fundamental picture with consistent losses and declining revenue, typical of an R&D-heavy pharmaceutical firm. Investors in SPARC are essentially betting on the future success of its drug pipeline.
The Trendline Breakout pattern identified in your technical analysis suggests that the stock might be building momentum. If the market is anticipating a positive development (e.g., successful trial results, regulatory approval) that could fundamentally change its profitability, then the technical breakout might be a leading indicator. The immediate target of ₹233 would represent a significant upside.
However, it is crucial to understand that for a company like SPARC, technical breakouts can be highly speculative without a corresponding positive fundamental catalyst related to its drug development pipeline. The stock's movement is heavily dependent on news flow regarding its R&D projects.
Key Factors to Monitor:
Confirmation of Technical Breakout: Ensure the breakout is sustained with strong volume.
R&D Pipeline Progress: This is paramount. Track updates on their drug candidates, clinical trial results, and regulatory milestones.
Cash Burn Rate: Given its losses, monitor the company's cash position and burn rate.
Strategic Partnerships: Any new collaborations could provide funding and validation for its research.
Disclaimer: This analysis is for informational purposes only and does not constitute investment advice. Investing in R&D-focused pharmaceutical companies like SPARC carries inherently high risks due to the uncertainty of drug development and regulatory approvals. Always conduct your own thorough research, understand the company's drug pipeline, assess your risk tolerance, and consult with a qualified financial advisor before making any investment decisions.

SPARC is ready to spark !! This is monthly chart of SPARC
stock is making Ascending triangle pattern from 2008
Stock has good potential to go up till 420-450 levels in weeks to come
Currently prices are around 230 levels
Thank You !!

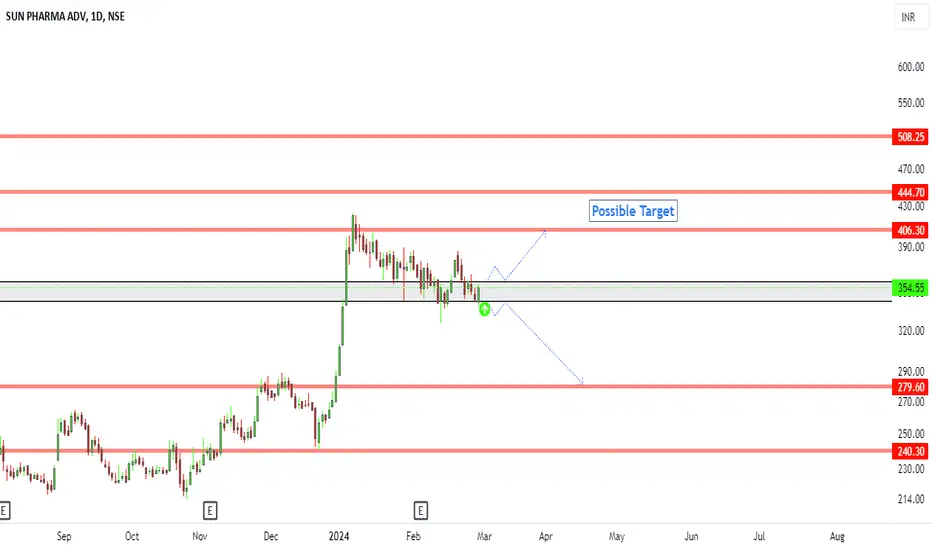
SUN PHARMA ADV-SWING TRADESUN PHARMA ADV-
Nice Head & Shoulder Breakout and Retest.
Stock gave a good Volume spike while breakout.
Retest volume is less than 20MA.
Best buy @ 260
SL @ 240
Target @ 350

SPARC BREAKOUT !!Round Bottom Breakout done.
Good for Short term and Long term.
Target 480 , 600, 750.
Do Like ,Comment , Follow for regular Updates...
Disclaimer : This is not a Buy or Sell recommendation. I am not SEBI Registered. Please consult your financial advisor before making any investments . This is for Educational purpose only.

After Retesting the breakout zone again raising for new highs340-345 is the breakout zone, after retesting and raising. We can consider for entry above 360 for a target 422.

#SPARC is getting ready for a sparkling move #superchartzKey Levels:
Support: 360 to 350
Resistance: 389, 399, 421
Key Drivers:
Sun Pharma Advanced Research Company Ltd focuses on R&D of pharmaceutical products, earning revenue from license fees, royalties, and R&D services. In FY23, it obtained USFDA approval for Sezaby and filed for NDA of PDP-716 in collaboration with Visiox Pharma. The company primarily targets oncology & neurodegeneration, with 8 pipeline assets in various stages. It has shifted focus from New Drug Delivery Systems to New Chemical Entities, investing heavily in R&D. SPARC is part of the SunPharma Group, with significant corporate backing. It faced an IT security incident in March 2023, though business operations were not directly impacted. The company plans Phase 1 studies for SCD-153 and SBO-154 in FY24 and FY25, respectively, aiming for continued growth through collaborations and new preclinical programs.

SPARC Buy Setup"Super valid-looking! Leave a comment if you like my entry setup. This share is for educational learning purposes only, and I am not responsible for your profit or loss. Note: For more details, check the chart."
Double bottom formationDouble bottom formation
FLag and pole breakout
MACD turning bullish
Target 450,480
SL 340

Sun Pharma Advanced Research Company Ltd*Sun Pharma Advanced Research Company Ltd*
P&F; Formation on Monthly Basis.
Price BreakOut Needed. To be Watched.
Resistance @ 390.
Vol. BuiltUp Getting Stronger.
RSI: 1H>DM. All in Bullish Zone.
EMAs: Widening Gaps amongst 20 /50 /100 /200.
*Trail SL with Upside*
*Book Profit as per Risk Appetite*
*_,Do Your Own Research as well. This is an Opinion._*
Happy Investing 😇

Perfect on-neck pattern breakout on daily chartA Bullish Breakout of On Neck pattern and a Rounding Bottom is visible on the Daily chart of NSE:SPARC
MACD gave Positive crossover on Daily, Weekly and Monthly chart. So, expecting the momentum to continue.
One can create a fresh position in the scrip as per the levels mentioned on the chart.
Risk Disclaimer:
The information provided in this analysis is based on my personal interpretation of market conditions and the available data at the time of writing. It is advisable to seek advice from a qualified financial professional and to conduct your own research before making any investment decisions.

Inverted Head & Shoulder breakoutThe stock has broken a 1.5 yr inverted H&S with 3x weekly volumes. Buy at 273 for a target of 336 in short term. Use a 1:2 risk reward.

SPARC Sun Pharma Advance Research Co Ltd
NSE:SPARC Sun Pharma Advance Research Co Ltd can take support from 232 or break 270.
We can buy near 232 and can see long term move above 270 with SL of 210 .
Major targets levels are highlighted in blue lines.

SparcPossible breakout on daily charts. Rising volumes for last 3 days. A possible upper circuit coming.!

💥SPARC💥-Nice Breakout💥SPARC💥-Nice Breakout
Capital to be deployed- 20k
Investing Price-306
Breakout Price-306
Stoploss-242
Targets-427-514-634
RT for max reach
#SPARC #stockstowatch #StocksToBuy #StocksInFocus #stocks #StockMarket

SPARC Long Inverse H & S in Weekly TimeframeSPARC Long Inverse H & S in Weekly Timeframe
The Trend channel changed from bearish to bullish in Daily
Can go long above 270 with good volume and candle close
Target - TP1 and TP2 mentioned in the chart.

SPARCStock name = Sun Pharma Adv.
Weekly chart setup
Chart is self explanatory. Levels of breakout, possible up-moves (where stock may find resistances) and support (close below which, setup will be invalidated) are clearly defined.
Disclaimer: This is for demonstration and educational purpose only. this is not buying and selling recommendations. I am not SEBI registered. please consult your financial advisor before taking any trade.

SPARC - Stock AnalysisSymbol: SPARC
Close: 273.05
Today's Volume: 10961383
Sector: Healthcare
Go Long above: 278.85
Stop Loss: 223.6
Resistance & Support:
📉 R: 282 || 291 || 303
📈 S: 261 || 249 || 240

SPARCThese are swing ideas which you can add your watchlist and analysis for yourself !
Keep on your radar!
This content only education purpose!
❗I am not sebi ragister❗


SPARCSPARC
Looks really good technically as the fundamentals seem to be improving as the losses are narrowing.( Not sure what's happening in the background)
An important Gann level breakout and forming an inverse h&S ok the higher time frames.
Weekly golden crossover in making as well.
Keep this in your watchlist and trade/invest based on the levels marked

Chances gaining the previous life time high. Broken Resistance once and currently at another resistance level.
Needs to cross dark red line. If crossed....It's gonna be fireworks.

SPARC big move awaitedSmall hurdle @224 after that next target 240/258/280. Hasnt moved much & with parent company approaching new ATH this can follow quickly.
HAPPY INVESTING!!
