SPLPETRO - Looks stronger and can BreakoutSPLPETRO on the Breakout level and RSI on most TF looks positive, good chances of giving a breakout
SPLPETRO trade ideas
Supreme PetroSuper tightness
decrease in vol during base formation
support at 50 EMA 2 times
high RS

SUPREME PETROCHEM LTD S/RSupport and Resistance Levels:
Support Levels: These are price points (green line/shade) where a downward trend may be halted due to a concentration of buying interest. Imagine them as a safety net where buyers step in, preventing further decline.
Resistance Levels: Conversely, resistance levels (red line/shade) are where upward trends might stall due to increased selling interest. They act like a ceiling where sellers come in to push prices down.
Breakouts:
Bullish Breakout: When the price moves above resistance, it often indicates strong buying interest and the potential for a continued uptrend. Traders may view this as a signal to buy or hold.
Bearish Breakout: When the price falls below support, it can signal strong selling interest and the potential for a continued downtrend. Traders might see this as a cue to sell or avoid buying.
MA Ribbon (EMA 20, EMA 50, EMA 100, EMA 200) :
Above EMA: If the stock price is above the EMA, it suggests a potential uptrend or bullish momentum.
Below EMA: If the stock price is below the EMA, it indicates a potential downtrend or bearish momentum.
Trendline: A trendline is a straight line drawn on a chart to represent the general direction of a data point set.
Uptrend Line: Drawn by connecting the lows in an upward trend. Indicates that the price is moving higher over time. Acts as a support level, where prices tend to bounce upward.
Downtrend Line: Drawn by connecting the highs in a downward trend. Indicates that the price is moving lower over time. It acts as a resistance level, where prices tend to drop.
Disclaimer:
I am not a SEBI registered. The information provided here is for learning purposes only and should not be interpreted as financial advice. Consider the broader market context and consult with a qualified financial advisor before making investment decisions.

SPLPETRO Trading Above Tested Demand ZoneSPLPETRO is currently trading at ₹657.5, above its tested demand zone between ₹656.3 and ₹632.8, established on 6th June 2024. This previously tested zone indicates historical buying interest. Investors may consider monitoring price action for potential reentry into this zone.
Disclaimer: This analysis is for informational purposes only and should not be considered as financial advice. Please conduct your own research or consult a financial advisor before making any investment or trading decisions.

Supreme Petro LongSupreme Petro
MTF Analysis
Supreme PetroYearly Demand 512
Supreme Petro 6 Month Demand BUFL 512
Supreme PetroQtrly Demand Breakout 502
Supreme PetroMonthly Demand 618
Supreme PetroWeekly Demand 842
Supreme PetroDaily Demand 794
ENTRY -1 842
SL 783
RISK 59
Potential Target 1182
First Target Points 980
First recovery Target Points 197
Last Swing Low 788
Last Swing High 985
RR 3
RR 40%

Supreme PetroSupreme Petro Month Demand 820
Supreme Petro Month Demand 820-Its a BUFL level
Supreme Petro Qtrly Demand 783-Its a BUFL level
Supreme Petro Weekly Demand 819-Its a BUFL level
Supreme Petro Daily Demand 860-Its a BUFL level
Supreme Petro Target 1050

SPLPETRO: A good buy with expreccted gains around 30%+Price is in a super bullish trend on monthly TF and has retraced significantly over the current month. This stock, based on technical analysis, may give a good entry in the coming days. Potential upside of the stock - 30%+.
Viewing the market sentiment and Nifty 50 price action, readers are advised to do their due diligence as this is not financial advice but it's just my opinion and views on the market and this stock.

MyPOV @ SUPREME PETROCHEM LTDMyPOV @ SUPREME PETROCHEM LTD
For educational purposes only. Not financial advice. Consult a professional before making financial decisions. #Disclaimer
#NiVYAMi

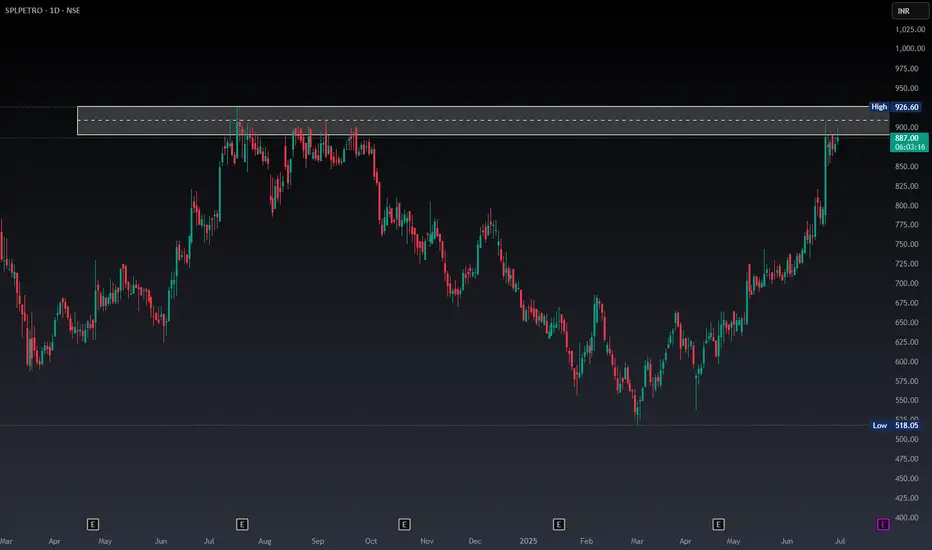
splpetro , Next leg Upcrossed ATH with high vol,New ATH made with a clear retractment with a clear vol build up which suggest a higher possibility of next leg Up

SPLPetro Long Term (1-3 Year) Portfolio BuildUpSupreme Petrochem Ltd (SPL) is a petrochemical company engaged in the business of manufacturing Polystyrene, Compounds of Styrenics, and other Polymers.
The company is almost debt-free.
The company has delivered good profit growth of 32.5% CAGR over the last 5 years
The company has delivered healthy OPM and ROCE and has Long Term Credit Rating AA-
The company is the undisputed leader in Polystyrene in India, with a market share
exceeding 50%.
Tech: Price Action is making HH and HL on Daily TF and 75 TF there has been a consolidation and if it breaks 578 with the strong candle. It will be good for buying for 1:3x trade for long term perspective.

💥Supreme Petrochem💥- Nice Breakout💥Supreme Petrochem💥- Nice Breakout
Capital to be deployed- 20k
Investing Price -510-520
Breakout Price -503
Stoploss-431
Targets-641-847
RT for max reach.
#Supremepetro #StocksToBuy #stocks #StocksToTrade #StocksInFocus #stockstowatch #StocksInNews

Strong Breakout Stock! #SPLPETROStrong Breakout Stock!
Supreme Petrochem Ltd #SPLPETRO
1- 10 Months Consolidation
2- High Weekly Volumes
3- Near Lifetime High
Note: Technical Analysis is for Educational Purpose. I am not SEBI registered. Consult your financial advisor for any Investment Advice.

Supreme Petrochem for investmentGood Funadmentals
Company has reduced debt.
Company is almost debt free.
Company has delivered good profit growth of 29.4% CAGR over last 5 years
Company has a good return on equity (ROE) track record: 3 Years ROE 43.7%
Company has been maintaining a healthy dividend payout of 34.4%
Good to accumlate around 620-720 for long term investment.
SL 500 CLB.
Saptarish Trading
Views are for education only, not a SEBI registered advisor.

supremepetro could correct to 475 leveli see the stock coming to the green circle one day....around 475

Supreme Petrochem IndiaSun Storm Investment Trading Desk & NexGen Wealth Management Service Present's: SSITD & NexGen Portfolio of the Week Series
Focus: Worldwide
By Sun Storm Investment Research & NexGen Wealth Management Service
A Profit & Solutions Strategy & Research
Trading | Investment | Stocks | ETF | Mutual Funds | Crypto | Bonds | Options | Dividend | Futures |
USA | Canada | UK | Germany | France | Italy | Rest of Europe | Mexico | India
Disclaimer: Sun Storm Investment and NexGen are not registered financial advisors, so please do your own research before trading & investing anything. This is information is for only research purposes not for actual trading & investing decision.
#debadipb #profitsolutions
