STAR CEMENT LTD S/R Support and Resistance Levels:
Support Levels: These are price points (green line/shade) where a downward trend may be halted due to a concentration of buying interest. Imagine them as a safety net where buyers step in, preventing further decline.
Resistance Levels: Conversely, resistance levels (red line/shade) are where upward trends might stall due to increased selling interest. They act like a ceiling where sellers come in to push prices down.
Breakouts:
Bullish Breakout: When the price moves above resistance, it often indicates strong buying interest and the potential for a continued uptrend. Traders may view this as a signal to buy or hold.
Bearish Breakout: When the price falls below support, it can signal strong selling interest and the potential for a continued downtrend. Traders might see this as a cue to sell or avoid buying.
MA Ribbon (EMA 20, EMA 50, EMA 100, EMA 200) :
Above EMA: If the stock price is above the EMA, it suggests a potential uptrend or bullish momentum.
Below EMA: If the stock price is below the EMA, it indicates a potential downtrend or bearish momentum.
Trendline: A trendline is a straight line drawn on a chart to represent the general direction of a data point set.
Uptrend Line: Drawn by connecting the lows in an upward trend. Indicates that the price is moving higher over time. Acts as a support level, where prices tend to bounce upward.
Downtrend Line: Drawn by connecting the highs in a downward trend. Indicates that the price is moving lower over time. It acts as a resistance level, where prices tend to drop.
Disclaimer:
I am not a SEBI registered. The information provided here is for learning purposes only and should not be interpreted as financial advice. Consider the broader market context and consult with a qualified financial advisor before making investment decisions.
STARCEMENT trade ideas

Beginning of a DUOPOLY - Great OpportunityUltratech cement has approved an acquisition of 8.69% stake in Star cement for Rs 851 crore. As mentioned earlier in my post of August 26 that their is a possible chance of creation of duopoly in the cement sector after Adani's entrance in the sector it has been adamant after looking to the aggressive acquisitions made by Ultratech and Adani group. Till now Ultratech cement has taken stakes in Kesoram industries, India cements and Star cement while Adani Group has taken stakes in Ambuja, ACC, Sanghi Industries, Penna Cement and Orient Cement. As we know that Greenfield projects are limited due to limited natural resources, production capacity can only be increased and dominance can be maintained by acquiring small companies. Because of this tug of war share prices of small companies have surged significantly. Star cement has given a return of 40% in 2024. It's present capacity is 7.7 MTPA and plans to increase the capacity to 25 MTPA by 2030. Cement sector is going to be exciting in the coming years. Do keep a track and be updated about the sector.

Technical Analysis of STARCEMENT- Buy & Hold (Long Term Bullish)STARCEMENT Technical Analysis Summary - Here's a breakdown of some technical indicators for STARCEMENT:
Moving Averages: :- This is my personal opinion and technical analysis done on the chart by applying different indicators on short to long term time frames and result of those indicators are as follow:-
Moving Averages
Short-term (MA5, MA10, MA20): Neutral to Buy signal
Long-term (MA50, MA100, MA200): Sell signal
Oscillators:
RSI: Neutral
Stochastic Oscillator: Sell signal
MACD: Sell signal
Other Oscillators (CCI, Williams %R, etc.): Mixed signals
Overall: Technical analysis for STARCEMENT is currently neutral. There are both bullish and bearish signals present. You can buy this stock and hold for long term for maximum profit
Important Disclaimer: Technical analysis is not a perfect science and should not be used alone to make investment decisions. It's important to consider other factors, such as company fundamentals, overall market conditions, and your own risk tolerance.
Thanks for your support as always

STAR CEMENT LEVELS FOR SWING TRADING 18/06/2024STOCKS FOR SWING TRADING (SHORT TERM) 18/06/2024
NO.6
#STARCEMENT
Buy Price - 224 (CMP 223)
SL - 210
TARGET - 245, 280 (10 - 25%)
@jagadheeshjp
Disclaimer : All information on this page is for educational purposes only,
we are not SEBI Registered, Please consult a SEBI registered financial advisor for your financial matters before investing And taking any decision. We are not responsible for any profit/loss you made.

#STARCEMENTDaily chart is strong for the stock, after weak results for the quarter stock took a dip, stock has given the breakout in March-24 and now retest the breakout levels, near the support zone, so risk reward is favourable. Long term RS strong. Short term RS near 0 line. Buy at current price with stop loss 212 for the target 234 in next 15-30 days.

STARCEMENT looks good.STARCEMENT looks good for above targets within 3-5 days.
This is only for educational purpose.

#STAR cement 2 consecutive day close above 174.4, fir to udega?Star cement is consolidating in a tight range since 15th Nov 2023. If it manages to give 2 consecutive day close above FIB level of 174.4 then it should move fast towards 1) 177.45 2) 181.9 3) 190 4) 196 5) 199. Below 162 it will become weak.


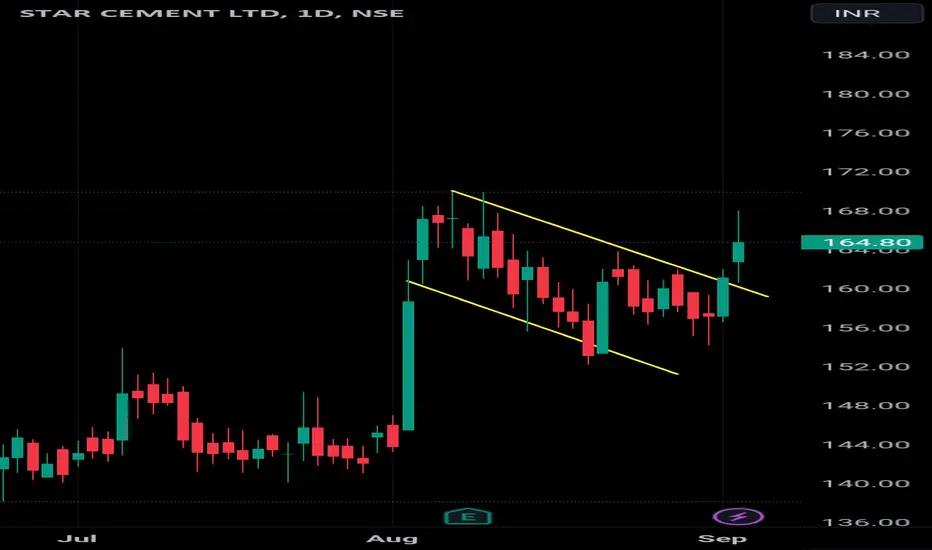
STAR CEMENT STAR CEMENT (1D)
CMP 164.80
Stock price has given breakout of Downward trending channel
Flag & pole pattern breakout
Cement sector looking bullish
Stock can give upticks from here
#STARCEMENT Ready for a potential breakout !🌟Star Cements Ltd is engaged in manufacturing and selling of Cement Clinker & Cement. It sells its products across north-eastern and eastern states in India. It is the largest cement manufacturer in North-east India.
🌟-Fair amount of contraction seen on daily chart.
🌟- Breakout above 160 Support 150
🌟- Price Respecting 20 & 50 EMA
🌟- 50% Upthrust seen in stock recently.
🌟- RR Favorable for going long.
Don't forget to hit that❤️for a like🔁for a share,and🔖for a bookmark!

Star Cement Ltd potential Cup with Handle patternA nice giant saucer bottom has formed over a span of more than 5 years.
Expecting a small handle formation before blasting off towards it's technical target of 240+
Good to enter around 130 levels for a target of 240 with SL below 115.
84.6% ROI with 1:7 R:R
Stable fundamentals.
Do your own due diligence before taking any action.
Peace!!

Star Cement - Start in Making Star Cement is making positive moves. Trading above 140, will consilidate in range of 140-150. Beyond it can be a black horse in blue sky zone. Keep on watchlist.

STAR CEMENT looks good on chartNSE:STARCEMENT
Multi-year break out possible
Target 135 range
Stop loss 100

Breakout after 4 years|Stock to watch for Next week|Swing TradeDisclaimer:I am not a Sebi-Register Advisor, Please consult your financial advisor before making any investment.

BREKOUT AND PERFECT RETRACEMENT ON STARCEMENT WEEKLY TIMEFRAMEBREKOUT on starcement weekly timeframe. Anyone else feel the same, share your thoughts on this. I'm more interested on weekly breakouts.


STAR CEMENTStar Cement can Break Out anytime the Falling Trend Line after 5 years on Monthly Chart. Price has got good hold and showing strength.
SL - 90 looks good on a weekly chart as pullback occurred for the first time.
Initially it may test 120 levels at the earliest (safe side) or can be higher and subsequently can achieve 136 target.

Star CementI bought Star Cement
Manual trend is bullish
Bullish crossover between 100 and 200 EMA (not complete)
Bullish crossover in RSI
SL around 95
T1 115 / T2 open

Star cementStar cement trading below 200 ma. Once price cross 200 ma resistance then easily go to 130 inr. Fails comes to 76 . Keep eye on 200 ma resistance trade plan to Reduce loss.

Star Cement BreakoutThe stock has broken out and retested, therefore may undergo a reversal rally. Trade is supported by brokerage calls and Supports Nearby.
Risk Reward Ratio - 3:1
SL is placed below support zone & the lower trendline. The target is placed near resistance.

STAR CEMENT LIMITED (LONG)Expected to go up from hereBuy near 104
SL 102
Tgt 108-114-117-119
Support further down 99 - 96- 95 - 94
making a W pattern
Must Correlate yourself also on charts before taking an entry. This is for Educational purposes only. Please consult your Financial advisor before investing.

inverted head and shoulder pattern in star cementinverted head and shoulder pattern
horizontal resistance breakout
higher lows pattern
lower supportive trendline
volume breakjout after consolidation
