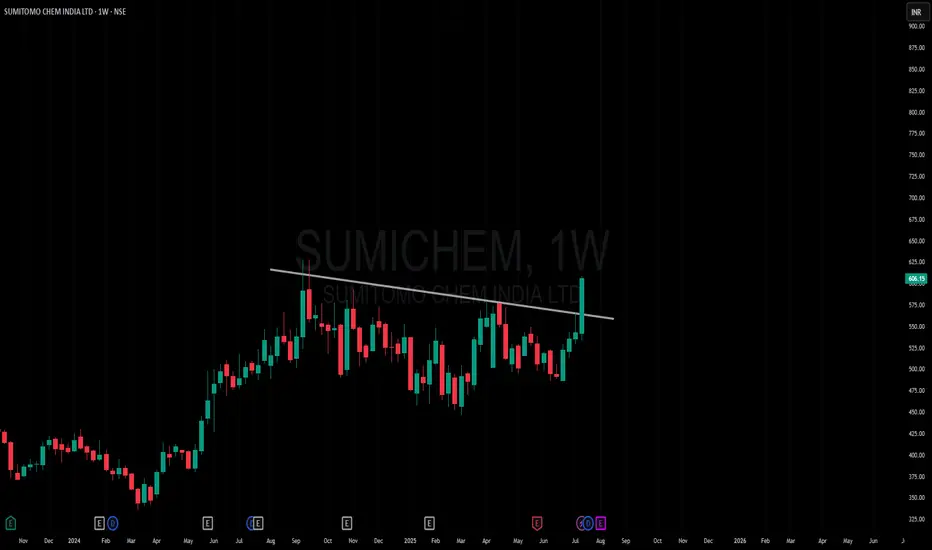
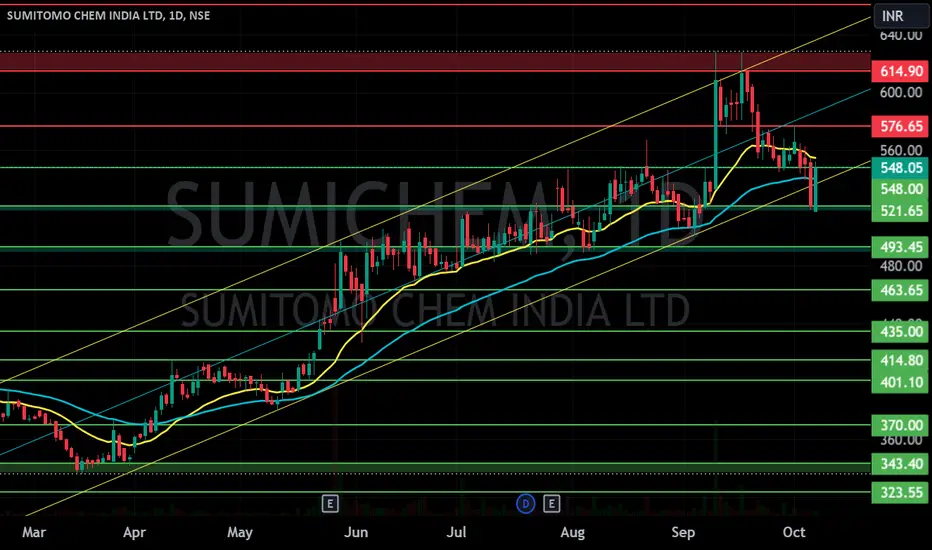
Amazing breakout on WEEKLY Timeframe - SUMICHEMCheckout an amazing breakout happened in the stock in Weekly timeframe, macroscopically seen in Daily timeframe. Having a great favor that the stock might be bullish expecting a staggering returns of minimum 25% TGT. IMPORTANT BREAKOUT LEVELS ARE ALWAYS RESPECTED!
NOTE for learners: Place the break
Next report date
—
Report period
—
EPS estimate
—
Revenue estimate
—
10.15 INR
5.05 B INR
31.24 B INR
122.70 M
About SUMITOMO CHEM INDIA LTD
Sector
Industry
CEO
Chetan Shantilal Shah
Website
Headquarters
Mumbai
Founded
2000
ISIN
INE258G01013
FIGI
BBG00RJV74N0
Sumitomo Chemical India Ltd. engages in the manufacture and sale of agricultural and household insecticides and animal nutrition products. Its products include crop protection chemicals, feed additives, fumigants and rodenticides, and bio pesticides. It operates through the India and Outside India geographical segments. The company was founded on February 15, 2000 and is headquartered in Mumbai, India.
Related stocks

SumiChem , 1W and 1DLooks Very Good in Weekly and Daily Time Frame
Put SL according to your Capital Capacity and Risk Apeatite
Nifty is Also Looking Very Bullish a-, so no one can Stop Breakout Stocks until Nifty comes to consolidation
it is very good pattern , because same pattern is repeating after long time and

SUMICHEM S/RSupport and Resistance Levels:
Support Levels: These are price points (green line/shade) where a downward trend may be halted due to a concentration of buying interest. Imagine them as a safety net where buyers step in, preventing further decline.
Resistance Levels: Conversely, resistance levels (re
Darvas Box Strategy - Breakout StockDisclaimer: I am Not SEBI Registered adviser, please take advise from your financial adviser before investing in any stocks. Idea here shared is for education purpose only.
Stock has given break out. Buy above high. Keep this stock in watch list.
Buy above the High and do not forget to keep stop lo

Sumitomo Chem India Ltd: Weekly Breakout with Strong Buy Signal!📊 Sumitomo Chemical India Ltd - Technical View
🔍 Weekly Timeframe:
Resistance Trendline Breakout 🚀
Big Bullish Green Candle with volume 📈
📈 Indicators:
MACD: Buy Signal ✅
Oscillators: Buy Signal ✅
💵 CMP : 608
📉 Key Levels:
Stoploss: 570
Target : 1:3
Trail your Stoploss for the targ

SUMICHEM | COMING OUT OF HUGE BASE | HIGH MOMENTUMMaking a contraction near all time high
Volume Contraction
High Momentum

Can accumulate this fundamentally strong stockCan start accumulating this fundamentally strong stock. Its available at 30% discount, as the chemical sectors weak performance since last 2 years. So its a best time to start accumulate this stock. Fibonacci levels and trendlines are marked in charts.

Sumitomo Chemical India Ltd *Sumitomo Chemical India Ltd*
P&F; Formation on Yearly Basis.
Strong Vol Consolidation & Continued Traction.
Price BreakOut Needed & to be Watched.
RSI: 1HW>M. All in Bullish Zone but 1H TF.
EMAs: Widening Gaps amongst 20/ 50/ 100/ 200 on Weekly Basis.
Subdued FY24. Q1/2 Results to be Watched.
*

Sumitomo chemical monthly break out confirm soon Sumitomo Chemical Industries after long time on clear cut break out. I see a strong up side relly in all chemical sector shares.
ABOUT company
Sumitomo Chemical India Ltd. (SCIL) is one of the leading players in the industry which has a balanced portfolio of technical as well as formulation produc

See all ideas
Summarizing what the indicators are suggesting.
Neutral
SellBuy
Strong sellStrong buy
Strong sellSellNeutralBuyStrong buy
Neutral
SellBuy
Strong sellStrong buy
Strong sellSellNeutralBuyStrong buy
Neutral
SellBuy
Strong sellStrong buy
Strong sellSellNeutralBuyStrong buy
An aggregate view of professional's ratings.
Neutral
SellBuy
Strong sellStrong buy
Strong sellSellNeutralBuyStrong buy
Neutral
SellBuy
Strong sellStrong buy
Strong sellSellNeutralBuyStrong buy
Neutral
SellBuy
Strong sellStrong buy
Strong sellSellNeutralBuyStrong buy
Displays a symbol's price movements over previous years to identify recurring trends.
Frequently Asked Questions
The current price of SUMICHEM is 584.90 INR — it has decreased by −1.02% in the past 24 hours. Watch SUMITOMO CHEM INDIA LTD stock price performance more closely on the chart.
Depending on the exchange, the stock ticker may vary. For instance, on NSE exchange SUMITOMO CHEM INDIA LTD stocks are traded under the ticker SUMICHEM.
SUMICHEM stock has fallen by −1.74% compared to the previous week, the month change is a 12.05% rise, over the last year SUMITOMO CHEM INDIA LTD has showed a 17.00% increase.
We've gathered analysts' opinions on SUMITOMO CHEM INDIA LTD future price: according to them, SUMICHEM price has a max estimate of 666.00 INR and a min estimate of 545.00 INR. Watch SUMICHEM chart and read a more detailed SUMITOMO CHEM INDIA LTD stock forecast: see what analysts think of SUMITOMO CHEM INDIA LTD and suggest that you do with its stocks.
SUMICHEM reached its all-time high on Sep 10, 2024 with the price of 628.30 INR, and its all-time low was 151.05 INR and was reached on Mar 25, 2020. View more price dynamics on SUMICHEM chart.
See other stocks reaching their highest and lowest prices.
See other stocks reaching their highest and lowest prices.
SUMICHEM stock is 2.04% volatile and has beta coefficient of 1.12. Track SUMITOMO CHEM INDIA LTD stock price on the chart and check out the list of the most volatile stocks — is SUMITOMO CHEM INDIA LTD there?
Today SUMITOMO CHEM INDIA LTD has the market capitalization of 291.75 B, it has increased by 8.55% over the last week.
Yes, you can track SUMITOMO CHEM INDIA LTD financials in yearly and quarterly reports right on TradingView.
SUMITOMO CHEM INDIA LTD is going to release the next earnings report on Aug 4, 2025. Keep track of upcoming events with our Earnings Calendar.
SUMITOMO CHEM INDIA LTD revenue for the last quarter amounts to 6.79 B INR, despite the estimated figure of 7.39 B INR. In the next quarter, revenue is expected to reach 9.71 B INR.
SUMICHEM net income for the last quarter is 995.84 M INR, while the quarter before that showed 869.50 M INR of net income which accounts for 14.53% change. Track more SUMITOMO CHEM INDIA LTD financial stats to get the full picture.
Yes, SUMICHEM dividends are paid annually. The last dividend per share was 1.20 INR. As of today, Dividend Yield (TTM)% is 0.15%. Tracking SUMITOMO CHEM INDIA LTD dividends might help you take more informed decisions.
SUMITOMO CHEM INDIA LTD dividend yield was 0.21% in 2024, and payout ratio reached 11.85%. The year before the numbers were 0.26% and 12.16% correspondingly. See high-dividend stocks and find more opportunities for your portfolio.
As of Jul 27, 2025, the company has 5.13 K employees. See our rating of the largest employees — is SUMITOMO CHEM INDIA LTD on this list?
EBITDA measures a company's operating performance, its growth signifies an improvement in the efficiency of a company. SUMITOMO CHEM INDIA LTD EBITDA is 6.32 B INR, and current EBITDA margin is 19.85%. See more stats in SUMITOMO CHEM INDIA LTD financial statements.
Like other stocks, SUMICHEM shares are traded on stock exchanges, e.g. Nasdaq, Nyse, Euronext, and the easiest way to buy them is through an online stock broker. To do this, you need to open an account and follow a broker's procedures, then start trading. You can trade SUMITOMO CHEM INDIA LTD stock right from TradingView charts — choose your broker and connect to your account.
Investing in stocks requires a comprehensive research: you should carefully study all the available data, e.g. company's financials, related news, and its technical analysis. So SUMITOMO CHEM INDIA LTD technincal analysis shows the buy rating today, and its 1 week rating is buy. Since market conditions are prone to changes, it's worth looking a bit further into the future — according to the 1 month rating SUMITOMO CHEM INDIA LTD stock shows the strong buy signal. See more of SUMITOMO CHEM INDIA LTD technicals for a more comprehensive analysis.
If you're still not sure, try looking for inspiration in our curated watchlists.
If you're still not sure, try looking for inspiration in our curated watchlists.