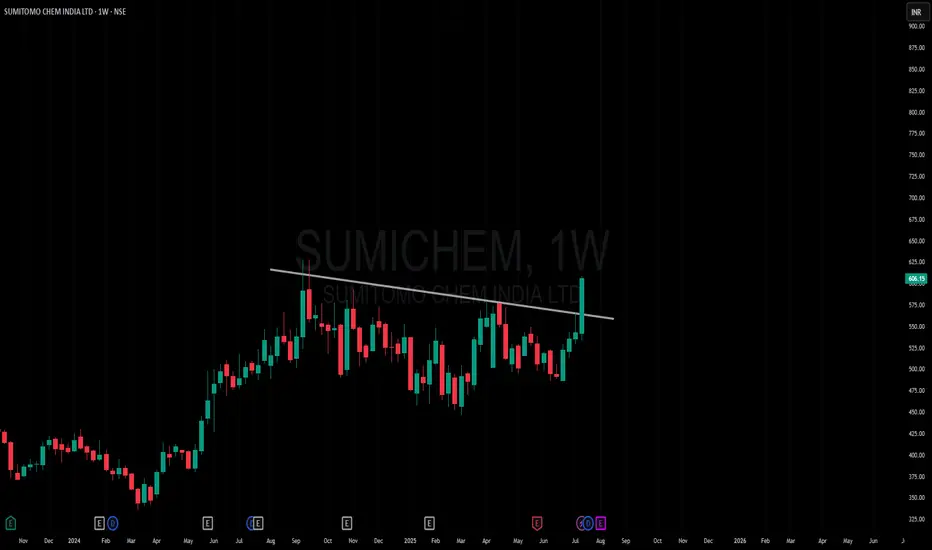
Amazing breakout on WEEKLY Timeframe - SUMICHEMCheckout an amazing breakout happened in the stock in Weekly timeframe, macroscopically seen in Daily timeframe. Having a great favor that the stock might be bullish expecting a staggering returns of minimum 25% TGT. IMPORTANT BREAKOUT LEVELS ARE ALWAYS RESPECTED!
NOTE for learners: Place the breakout levels as per the chart shared and track it yourself to get amazed!!
#No complicated chart patterns
#No big big indicators
#No Excel sheet or number magics
TRADE IDEA: WAIT FOR THE STOCK TO BREAKOUT IN WEEKLY TIMEFRAME ABOVE THIS LEVEL.
Checkout an amazing breakout happened in the stock in Weekly timeframe.
Breakouts happening in longer timeframe is way more powerful than the breakouts seen in Daily timeframe. You can blindly invest once the weekly candle closes above the breakout line and stay invested forever. Also these stocks breakouts are lifelong predictions, it means technically these breakouts happen giving more returns in the longer runs. Hence, even when the scrip makes a loss of 10% / 20% / 30% / 50%, the stock will regain and turn around. Once they again enter the same breakout level, they will flyyyyyyyyyyyy like a ROCKET if held in the portfolio in the longer run.
Time makes money, GREEDY & EGO will not make money.
Also, magically these breakouts tend to prove that the companies turn around and fundamentally becoming strong. Also the magic happens when more diversification is done in various sectors under various scripts with equal money invested in each N500 scripts.
The real deal is when to purchase and where to purchase the stock. That is where Breakout study comes into play.
Check this stock which has made an all time low and high chances that it makes a "V" shaped recovery.
> Taking support at last years support or breakout level
> High chances that it reverses from this point.
> Volume dried up badly in last few months / days.
> Very high suspicion based analysis and not based on chart patterns / candle patterns deeply.
> VALUABLE STOCK AVAILABLE AT A DISCOUNTED PRICE
> OPPURTUNITY TO ACCUMULATE ADEQUATE QUANTITY
> MARKET AFTER A CORRECTION / PANIC FALL TO MAKE GOOD INVESTMENT
DISCLAIMER : This is just for educational purpose. This type of analysis is equivalent to catching a falling knife. If you are a warrior, you throw all the knives back else you will be sorrow if it hits SL. Make sure to do your analysis well. This type of analysis only suits high risks investor and whose is willing to throw all the knives above irrespective of any sectoral rotation. BE VERY CAUTIOUS AS IT IS EXTREME BOTTOM FISHING.
HOWEVER, THIS IS HOW MULTIBAGGERS ARE CAUGHT !
STOCK IS AT RIGHT PE / RIGHT EVALUATION / MORE ROAD TO GROW / CORRECTED IV / EXCELLENT BOOKS / USING MARKET CRASH AS AN OPPURTUNITY / EPS AT SKY.
LET'S PUMP IN SOME MONEY AND REVOLUTIONIZE THE NATION'S ECONOMY!
SUMICHEM trade ideas

SumiChem , 1W and 1DLooks Very Good in Weekly and Daily Time Frame
Put SL according to your Capital Capacity and Risk Apeatite
Nifty is Also Looking Very Bullish a-, so no one can Stop Breakout Stocks until Nifty comes to consolidation
it is very good pattern , because same pattern is repeating after long time and it is Now Breaking Out from Channel pattern .
follow for more ideas like this swing Breakout Stocks

SUMICHEM S/RSupport and Resistance Levels:
Support Levels: These are price points (green line/shade) where a downward trend may be halted due to a concentration of buying interest. Imagine them as a safety net where buyers step in, preventing further decline.
Resistance Levels: Conversely, resistance levels (red line/shade) are where upward trends might stall due to increased selling interest. They act like a ceiling where sellers come in to push prices down.
Breakouts:
Bullish Breakout: When the price moves above resistance, it often indicates strong buying interest and the potential for a continued uptrend. Traders may view this as a signal to buy or hold.
Bearish Breakout: When the price falls below support, it can signal strong selling interest and the potential for a continued downtrend. Traders might see this as a cue to sell or avoid buying.
20 EMA (Exponential Moving Average):
Above 20 EMA(50 EMA): If the stock price is above the 20 EMA, it suggests a potential uptrend or bullish momentum.
Below 20 EMA: If the stock price is below the 20 EMA, it indicates a potential downtrend or bearish momentum.
Trendline: A trendline is a straight line drawn on a chart to represent the general direction of a data point set.
Uptrend Line: Drawn by connecting the lows in an upward trend. Indicates that the price is moving higher over time. Acts as a support level, where prices tend to bounce upward.
Downtrend Line: Drawn by connecting the highs in a downward trend. Indicates that the price is moving lower over time. It acts as a resistance level, where prices tend to drop.
RSI: RSI readings greater than the 70 level are overbought territory, and RSI readings lower than the 30 level are considered oversold territory.
Combining RSI with Support and Resistance:
Support Level: This is a price level where a stock tends to find buying interest, preventing it from falling further. If RSI is showing an oversold condition (below 30) and the price is near or at a strong support level, it could be a good buy signal.
Resistance Level: This is a price level where a stock tends to find selling interest, preventing it from rising further. If RSI is showing an overbought condition (above 70) and the price is near or at a strong resistance level, it could be a signal to sell or short the asset.
Disclaimer:
I am not a SEBI registered. The information provided here is for learning purposes only and should not be interpreted as financial advice. Consider the broader market context and consult with a qualified financial advisor before making investment decisions.
Darvas Box Strategy - Breakout StockDisclaimer: I am Not SEBI Registered adviser, please take advise from your financial adviser before investing in any stocks. Idea here shared is for education purpose only.
Stock has given break out. Buy above high. Keep this stock in watch list.
Buy above the High and do not forget to keep stop loss, best suitable for swing trading.
Target and Stop loss Shown on Chart. As Stop loss is Big, Risk to Reward Ratio/ Target Ratio 1:1.
Be Discipline, because discipline is the key to Success in Stock Market.
Trade what you See Not what you Think.

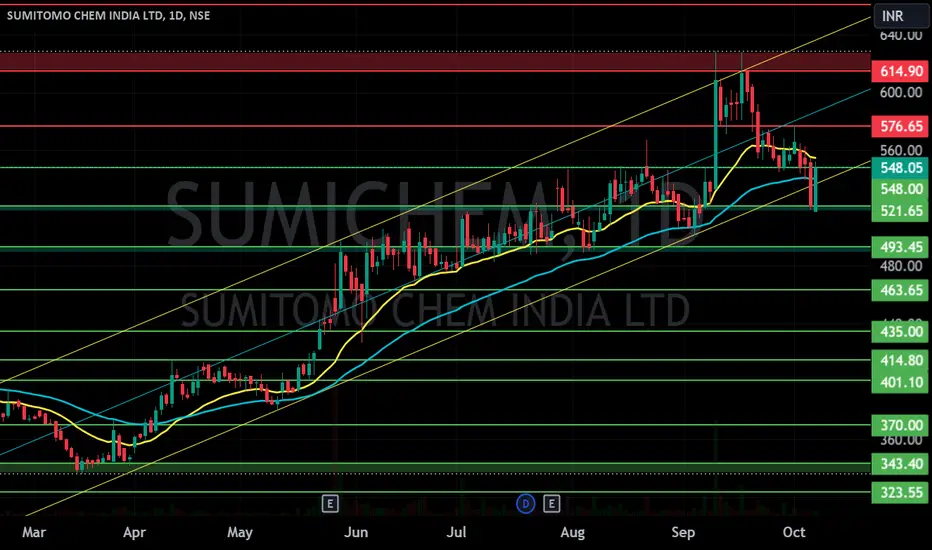
Sumitomo Chem India Ltd: Weekly Breakout with Strong Buy Signal!📊 Sumitomo Chemical India Ltd - Technical View
🔍 Weekly Timeframe:
Resistance Trendline Breakout 🚀
Big Bullish Green Candle with volume 📈
📈 Indicators:
MACD: Buy Signal ✅
Oscillators: Buy Signal ✅
💵 CMP : 608
📉 Key Levels:
Stoploss: 570
Target : 1:3
Trail your Stoploss for the target of 1:3
Target 1: 630
Target 2: 660
Target 3: 700
Disclaimer : "Please do not base your trades solely on the ideas mentioned above. Conduct your own research before making any trading decisions. We are not responsible for any financial losses that may result from applying this study or from taking any early entry or exit in trades."
#StockMarket #TechnicalAnalysis #Breakout #Bullish #SumitomoChemical #Trading

SUMICHEM | COMING OUT OF HUGE BASE | HIGH MOMENTUMMaking a contraction near all time high
Volume Contraction
High Momentum

Can accumulate this fundamentally strong stockCan start accumulating this fundamentally strong stock. Its available at 30% discount, as the chemical sectors weak performance since last 2 years. So its a best time to start accumulate this stock. Fibonacci levels and trendlines are marked in charts.

Sumitomo Chemical India Ltd *Sumitomo Chemical India Ltd*
P&F; Formation on Yearly Basis.
Strong Vol Consolidation & Continued Traction.
Price BreakOut Needed & to be Watched.
RSI: 1HW>M. All in Bullish Zone but 1H TF.
EMAs: Widening Gaps amongst 20/ 50/ 100/ 200 on Weekly Basis.
Subdued FY24. Q1/2 Results to be Watched.
*Trail SL with Upside*
*Book Profit as per Risk Appetite*
*Do your own research as per. This is an Opinion.*
*_Happy Investing_*🤓

Sumitomo chemical monthly break out confirm soon Sumitomo Chemical Industries after long time on clear cut break out. I see a strong up side relly in all chemical sector shares.
ABOUT company
Sumitomo Chemical India Ltd. (SCIL) is one of the leading players in the industry which has a balanced portfolio of technical as well as formulation products along with backward integration for some products. The Company is known for domestic marketing of proprietary products of its Japanese parent -Sumitomo Chemical Company Limited in agrochemicals, animal nutrition, and environmental health business segments. With the integration of Excel Crop Care Limited, the Company now has a strong portfolio of generics in addition to specialty products and a strong combined marketing network. With this integration, the Company has moved up several notches in the pecking order of the Indian crop protection industry. SCIL has also marked its presence in Africa and several other geographies of the world.

SUMICHEMFlag breakout - But current candle has not closed yet.
Disclaimer: Intended for educational purpose only and it's not a buy or sell recommendation.

sumitomo-- chem ACCUMULATEinvestors do you observe positive divergence--- accumulate as chem sector to show some consolidation --icing on cake high promotor stake of 75 %. and company performing well in sept qtr .. accumulate on every dip as we might end ABC wave in next one month .


Sumitomo Chemicals - Is It right to buy? I don't think soFormed Head and Shoulders, will wait for it to break and reach demand zone and then will start accumulating....

SUMITOMO CHEMICALSumitomo chemicals every test from its 52 week low and now it's in a range breakout of this range at the purple line would definitely be a point of entry we can add a fresh entry there in the nearest target would be 52 week high then we can see moreover new highs . Whereage promoter holding is concerned its 75% which is good but overall fundamentals are a bit confusing but still it could be a good share to invest

Sumitomo ChemicalAnimal feeding products and home and agricultural pesticides are produced and sold by Sumitomo Chemical India Ltd. Chemicals for crop protection, feed additives, fumigants and rodenticides, and bio pesticides are among its offerings.
On CMP (419), Sumitomo Chemical appears to be attractive. I think it has the ability to provide us with a good return in the near future.
This is solely for educational purposes and is not intended as advice.
with the keep SL of Rs. 402-408 to accumulate for the 452, 477 TGT.
Before making an investment, kindly consult your advisor.
I'm not a financial expert.

Sumi Chem - First Time Since ListingInvesting 1% of capital, and seems to be in a good buying zone.
In my opinion, we are about to see a 30-40% growth over a year horizon.
Buy Price: 420
Qty 25
Target 30-40%
SL to be used to protect profit.

SUMITOMO CHEMICALS - On Recovery ModeThe Stock recovering from the recent bottom. Making Higher Highs and Higher Lows. Now moving past the 200 ema and already above the other short term emas. Relative strength , Money flow and Buying Pressure all positive. Now looks Strong to move up and test the previous high of 540 levels

Trendline Breakout in Sumitomo Chemical India Ltd...Chart is self explanatory.
Disclaimer: This is for demonstration and educational purpose only. This is not buying or selling recommendations. I am not SEBI registered. Please consult your financial advisor before taking any trade.


Sumitomo Chemical: soon to breakoutSumitomo chemical is a strong candidate for a potential breakout. Keep it on your radar!

daily chart analysis for SUMICHEMStock analysis for SUMITOMO CHEMICAL IND LTD
keep watching add to watch list
price falling each time when touches to upper trend line
with conforming signal by RSI falling when it touch to 70
again price is testing upper trend line and RSI at 70 from here we can expect down side move in stock to lower trend line
if price successfully closes above upper trend line then it may go more up side
if price breakdown the lower trend line then rsi trend line will also break then will consider it more fresh selling and fall in price

