Sundaram Finance - Cup Pattern breakoutSundaram Finance Holdings Ltd.
CUP pattern breakout on WEEKLY timeframe.
Multiyear High.
High Trade and Delivery Quantity this week.
Close within 52 week zone.
Disclaimer:
For educational purpose only.
Please do your own research before taking any trades.
Happy Trading!
20.65 INR
4.12 B INR
1.60 B INR
101.74 M
About SUNDARAM FINANCE HOLD LTD
Sector
Industry
CEO
Subramaniam Ravi
Website
Headquarters
Chennai
Founded
1993
ISIN
INE202Z01029
FIGI
BBG00HT23ZS5
Sundaram Finance Holdings Ltd. engages in the business of distribution of financial products. It operates through the following segments: Investments, Domestic Support Services, and Overseas Support Services. The company was founded on October 13, 1993 and is headquartered in Chennai, India.
Related stocks

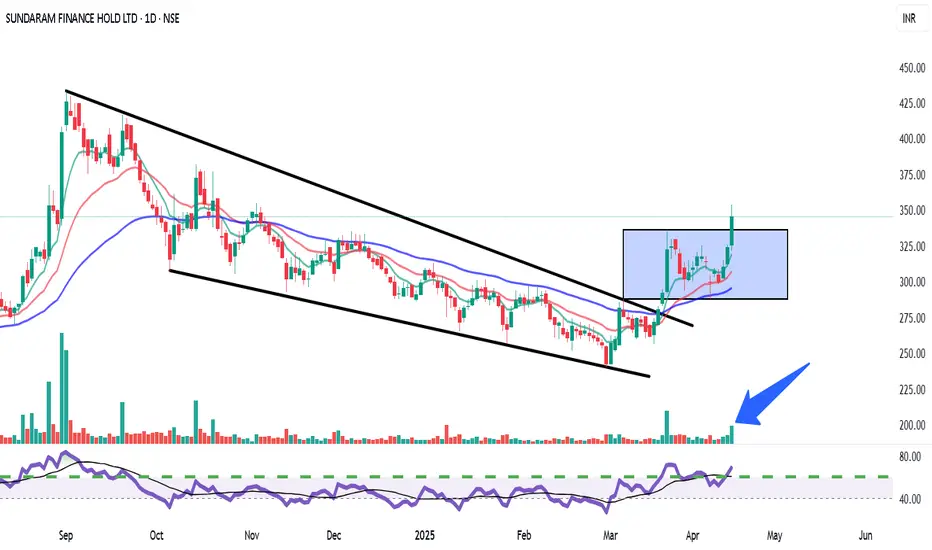
Sundaram Finance | Falling Wedge Breakout with Strong Volume Pattern: Falling Wedge breakout followed by consolidation (bullish continuation).
Breakout Confirmation: Clean breakout from both the wedge and the consolidation box with strong volume.
Indicators:
Volume: Spike visible (🔵 arrow) – confirming strength.
RSI: Crossed above 60 – entering bullish mo
SUNDARMHLD 330 is buy good level SUNDARMHLD 330 is buy good level
Is good BTST Good
Weekly Breakout
level Study and buy
only for
Education purpose

Sundaram finance Holding IPO BasedIPO Based Strategy
Darvas boxes are a fairly simple indicator created by drawing a line along lows and highs. As you update the highs and lows over time, you will see rising boxes or falling boxes. Darvas box theory suggests only trading rising boxes and using the highs of the boxes that are breach

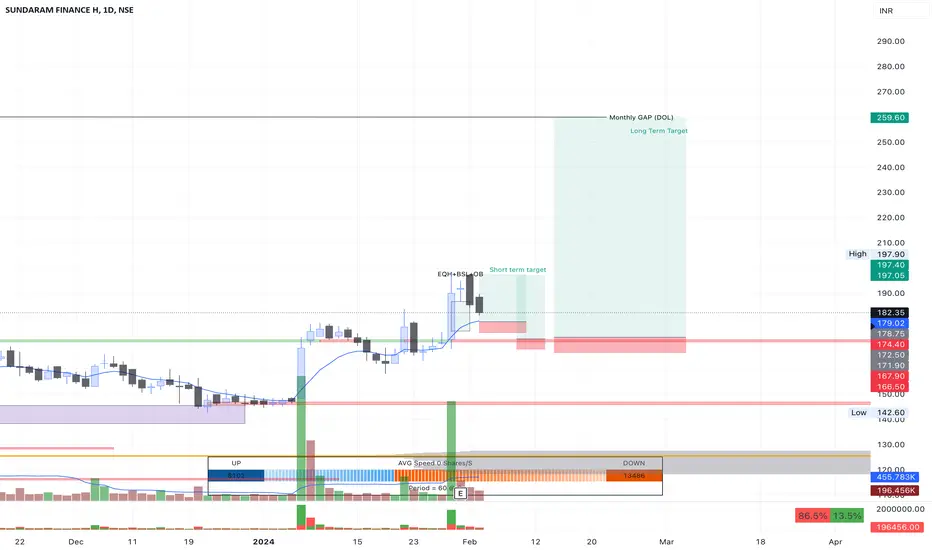
5 Year Long Breakout in SUNDARMHLDA 5 year breakout in Sundaram Finance holding. Daily chart has too many gaps because of the continuous gap downs, Weekly chart shows good momentum is due and ahead in this stock.
Buy around 135 and hold with your own Risk, Round bottom target for me and 175 in short term.

SUNDARMHLD BUYOver here we can see price is reverting bac into fair value gap near its support areas. I have positioned two possible point of interest entries on the chart for everyone to consider. In the short term, we will be targeting the order block on the sell side. If you are a longer term investor and can
Sundaram Finance : Bullish "N"
Bullish N shape has formed on weekly chart.
Volume is supporting the trend
These days finance stocks are in bullish trend.
Typical copy book rounding pattern is visible on monthly chart
TARGET : 200
STOP LOSS: 150
**These are my personal observations. Please trade at your own risk.**

SUNDARAM FINANCE, Possibility of pullback @143, upward potentialLooking good on weekly and monthly chart, Possibility of pullback @143, then ready for up move up to Rs. 170
*Only for Educational purpose, no recommendation for Buy or Sell

SUNDARAM FINANCE 1w time frame buy @ 126 target @140.75, 143, SUNDARAM FINANCE 1w time frame
buy @ 126 target @140.75, 143, 146.50
ascending channel breakout
risk reward 1.4
its just a view trade @ your own risk
sl@110.50

Today stockUptrend moment in stock
Volume and breakout chart
Global and our market at bulish
This stock bulish
No recommendation for buy and sell
Take own analysis

See all ideas
Summarizing what the indicators are suggesting.
Oscillators
Neutral
SellBuy
Strong sellStrong buy
Strong sellSellNeutralBuyStrong buy
Oscillators
Neutral
SellBuy
Strong sellStrong buy
Strong sellSellNeutralBuyStrong buy
Summary
Neutral
SellBuy
Strong sellStrong buy
Strong sellSellNeutralBuyStrong buy
Summary
Neutral
SellBuy
Strong sellStrong buy
Strong sellSellNeutralBuyStrong buy
Summary
Neutral
SellBuy
Strong sellStrong buy
Strong sellSellNeutralBuyStrong buy
Moving Averages
Neutral
SellBuy
Strong sellStrong buy
Strong sellSellNeutralBuyStrong buy
Moving Averages
Neutral
SellBuy
Strong sellStrong buy
Strong sellSellNeutralBuyStrong buy
Displays a symbol's price movements over previous years to identify recurring trends.
Frequently Asked Questions
The current price of SUNDARMHLD is 450.65 INR — it has decreased by −1.99% in the past 24 hours. Watch SUNDARAM FINANCE HOLD LTD stock price performance more closely on the chart.
Depending on the exchange, the stock ticker may vary. For instance, on NSE exchange SUNDARAM FINANCE HOLD LTD stocks are traded under the ticker SUNDARMHLD.
SUNDARMHLD stock has fallen by −6.56% compared to the previous week, the month change is a −7.87% fall, over the last year SUNDARAM FINANCE HOLD LTD has showed a 58.68% increase.
SUNDARMHLD reached its all-time high on Jun 30, 2025 with the price of 541.90 INR, and its all-time low was 31.15 INR and was reached on Mar 23, 2020. View more price dynamics on SUNDARMHLD chart.
See other stocks reaching their highest and lowest prices.
See other stocks reaching their highest and lowest prices.
Yes, you can track SUNDARAM FINANCE HOLD LTD financials in yearly and quarterly reports right on TradingView.
SUNDARMHLD net income for the last quarter is 1.57 B INR, while the quarter before that showed 1.07 B INR of net income which accounts for 46.71% change. Track more SUNDARAM FINANCE HOLD LTD financial stats to get the full picture.
EBITDA measures a company's operating performance, its growth signifies an improvement in the efficiency of a company. SUNDARAM FINANCE HOLD LTD EBITDA is 1.29 B INR, and current EBITDA margin is 75.07%. See more stats in SUNDARAM FINANCE HOLD LTD financial statements.
Like other stocks, SUNDARMHLD shares are traded on stock exchanges, e.g. Nasdaq, Nyse, Euronext, and the easiest way to buy them is through an online stock broker. To do this, you need to open an account and follow a broker's procedures, then start trading. You can trade SUNDARAM FINANCE HOLD LTD stock right from TradingView charts — choose your broker and connect to your account.
Investing in stocks requires a comprehensive research: you should carefully study all the available data, e.g. company's financials, related news, and its technical analysis. So SUNDARAM FINANCE HOLD LTD technincal analysis shows the sell today, and its 1 week rating is buy. Since market conditions are prone to changes, it's worth looking a bit further into the future — according to the 1 month rating SUNDARAM FINANCE HOLD LTD stock shows the buy signal. See more of SUNDARAM FINANCE HOLD LTD technicals for a more comprehensive analysis.
If you're still not sure, try looking for inspiration in our curated watchlists.
If you're still not sure, try looking for inspiration in our curated watchlists.