buying zone Look for areas where the price has stalled or reversed: Supply and demand zones occur where there has been a concentration of buying or selling pressure, causing the price to stall or reverse. Look for areas on the chart where the price has struggled to move higher or lower, indicating potential sup
Next report date
—
Report period
—
EPS estimate
—
Revenue estimate
—
43.20 INR
17.03 B INR
40.15 B INR
84.74 M
About SUN TV NETWORK LTD
Sector
Industry
CEO
Maheshkumar Rajaraman
Website
Headquarters
Chennai
Founded
1985
ISIN
INE424H01027
FIGI
BBG000D5BDD8
Sun TV Network Ltd. provides television broadcasting services. The firm engages in the business of Broadcasting of General Entertainment, News Television Channels and FM Radio Channels. It operates through the Broadcasting segment. The company was founded by Kalanithi Maran on December 18, 1985 and is headquartered in Chennai, India.
Related stocks
SUNTV Trend directionSUNTV 629 has shown weakness. We expect It to hit the resistance 639 and to drop down to support 529

Suntv Daily & 1Hr TFits have been trading inside a parallel channel. after the good upside momentum it has corrected steadily and has taken support on the support trendline. looking good for a long trade with 610 or 600 as support with respect to the TF.
place the targets according to the TFs

Sun Tv bulish bat pattern Sun Tv bulish bat pattern cmp 631 on 09.02.2025 if form bulish candle in this zone it can easily complate the all target ... will see..

SunSUN tv possibilities of correction pattern. most probably the down leg is down now for a pull back to fall again to continue correction until impulse move is seen on the rise. protecting capital and the first target for any trade to be successful. probability is just shown on the chart

SUNTV : Reversal from Golden Retracement Zone SUN TV Network
Wave Analysis:
Prices have corrected to the golden retracement zone (712-698 INR), a strong potential reversal area.
The stock recently saw a CHOCH (Change of Character) near 768 INR, indicating bearish rejection at higher levels.
Key Observations:
Liquidity Zone: Prior liqui

#SUNTVSUNTV has just broken out of a Bullish Flag and Pole Pattern on DTF. Probable targets marked in a 3month to 6month time frame is good.

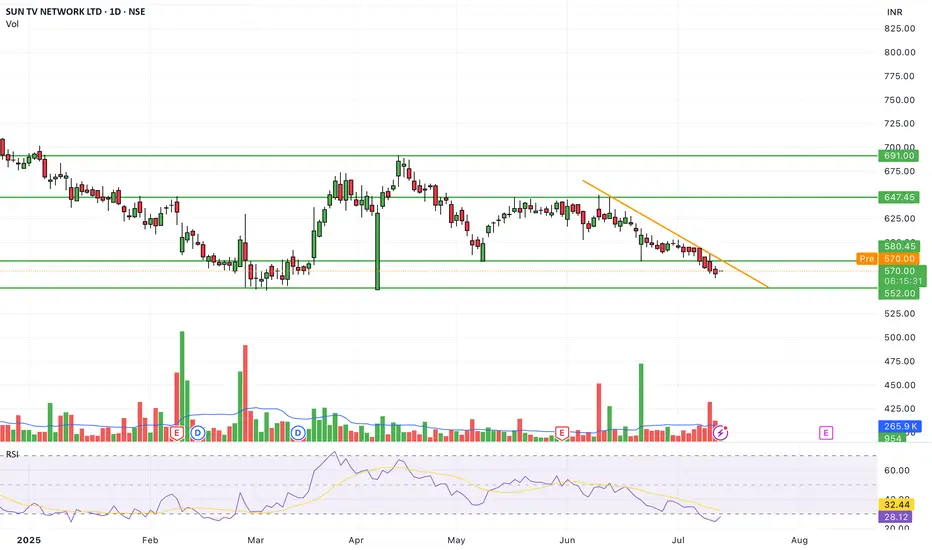
SUN TV NETWORK LTD S/R Support and Resistance Levels:
Support Levels: These are price points (green line/shade) where a downward trend may be halted due to a concentration of buying interest. Imagine them as a safety net where buyers step in, preventing further decline.
Resistance Levels: Conversely, resistance levels (re

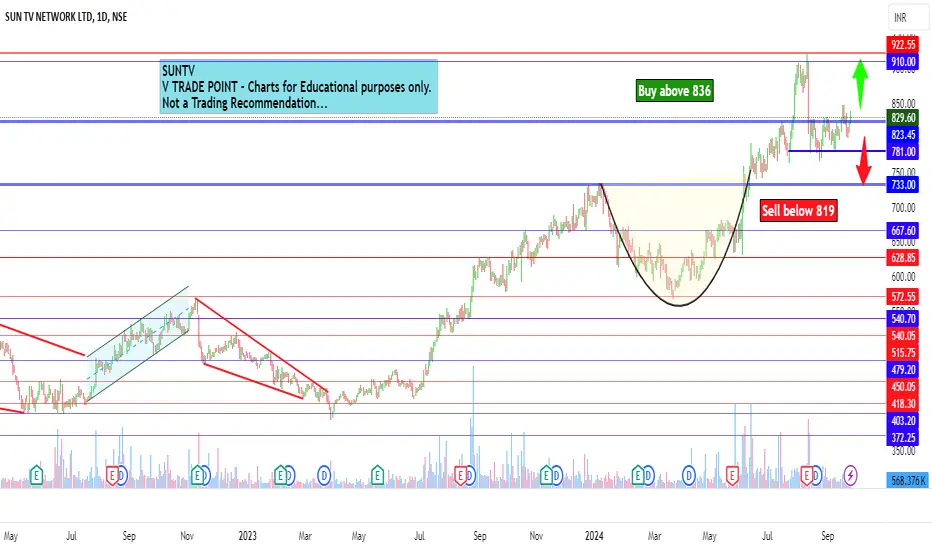
SUN TV Network Ltd view for Intraday 25th September #SUNTV SUN TV Network Ltd view for Intraday 25th September #SUNTV
Buying may witness above 836
Support area 824-825. Below ignoring buying momentum for intraday
Selling may witness below 819
Resistance area 824-825
Above ignoring selling momentum for intraday
Charts for Educational purposes only.
Plea
SUN TV HAS BROKEN THE RESISTANCE!Please remember the following information:
SUN TV has broken the resistance level of 829 on an hourly timeframe.
Entry: 829-833
Stop Loss: 815
Target Range: 860-865
Important Note: Sun TV Network's consolidated net profit for the quarter ended June has dropped by 6% to Rs 546 crore due to a decrea

See all ideas
Summarizing what the indicators are suggesting.
Neutral
SellBuy
Strong sellStrong buy
Strong sellSellNeutralBuyStrong buy
Neutral
SellBuy
Strong sellStrong buy
Strong sellSellNeutralBuyStrong buy
Neutral
SellBuy
Strong sellStrong buy
Strong sellSellNeutralBuyStrong buy
An aggregate view of professional's ratings.
Neutral
SellBuy
Strong sellStrong buy
Strong sellSellNeutralBuyStrong buy
Neutral
SellBuy
Strong sellStrong buy
Strong sellSellNeutralBuyStrong buy
Neutral
SellBuy
Strong sellStrong buy
Strong sellSellNeutralBuyStrong buy
Displays a symbol's price movements over previous years to identify recurring trends.
Frequently Asked Questions
The current price of SUNTV is 575.85 INR — it has decreased by −1.78% in the past 24 hours. Watch SUN TV NETWORK LTD stock price performance more closely on the chart.
Depending on the exchange, the stock ticker may vary. For instance, on NSE exchange SUN TV NETWORK LTD stocks are traded under the ticker SUNTV.
SUNTV stock has fallen by −0.21% compared to the previous week, the month change is a −3.56% fall, over the last year SUN TV NETWORK LTD has showed a −28.48% decrease.
We've gathered analysts' opinions on SUN TV NETWORK LTD future price: according to them, SUNTV price has a max estimate of 875.00 INR and a min estimate of 595.00 INR. Watch SUNTV chart and read a more detailed SUN TV NETWORK LTD stock forecast: see what analysts think of SUN TV NETWORK LTD and suggest that you do with its stocks.
SUNTV reached its all-time high on Jan 16, 2018 with the price of 1,097.80 INR, and its all-time low was 122.15 INR and was reached on Nov 28, 2008. View more price dynamics on SUNTV chart.
See other stocks reaching their highest and lowest prices.
See other stocks reaching their highest and lowest prices.
SUNTV stock is 1.97% volatile and has beta coefficient of 0.89. Track SUN TV NETWORK LTD stock price on the chart and check out the list of the most volatile stocks — is SUN TV NETWORK LTD there?
Today SUN TV NETWORK LTD has the market capitalization of 227.17 B, it has increased by 1.45% over the last week.
Yes, you can track SUN TV NETWORK LTD financials in yearly and quarterly reports right on TradingView.
SUN TV NETWORK LTD is going to release the next earnings report on Aug 8, 2025. Keep track of upcoming events with our Earnings Calendar.
SUNTV earnings for the last quarter are 10.95 INR per share, whereas the estimation was 11.04 INR resulting in a −0.79% surprise. The estimated earnings for the next quarter are 14.23 INR per share. See more details about SUN TV NETWORK LTD earnings.
SUN TV NETWORK LTD revenue for the last quarter amounts to 9.09 B INR, despite the estimated figure of 9.21 B INR. In the next quarter, revenue is expected to reach 12.77 B INR.
SUNTV net income for the last quarter is 3.72 B INR, while the quarter before that showed 3.63 B INR of net income which accounts for 2.34% change. Track more SUN TV NETWORK LTD financial stats to get the full picture.
SUN TV NETWORK LTD dividend yield was 2.30% in 2024, and payout ratio reached 34.70%. The year before the numbers were 2.79% and 34.29% correspondingly. See high-dividend stocks and find more opportunities for your portfolio.
EBITDA measures a company's operating performance, its growth signifies an improvement in the efficiency of a company. SUN TV NETWORK LTD EBITDA is 21.33 B INR, and current EBITDA margin is 53.12%. See more stats in SUN TV NETWORK LTD financial statements.
Like other stocks, SUNTV shares are traded on stock exchanges, e.g. Nasdaq, Nyse, Euronext, and the easiest way to buy them is through an online stock broker. To do this, you need to open an account and follow a broker's procedures, then start trading. You can trade SUN TV NETWORK LTD stock right from TradingView charts — choose your broker and connect to your account.
Investing in stocks requires a comprehensive research: you should carefully study all the available data, e.g. company's financials, related news, and its technical analysis. So SUN TV NETWORK LTD technincal analysis shows the strong sell today, and its 1 week rating is sell. Since market conditions are prone to changes, it's worth looking a bit further into the future — according to the 1 month rating SUN TV NETWORK LTD stock shows the sell signal. See more of SUN TV NETWORK LTD technicals for a more comprehensive analysis.
If you're still not sure, try looking for inspiration in our curated watchlists.
If you're still not sure, try looking for inspiration in our curated watchlists.