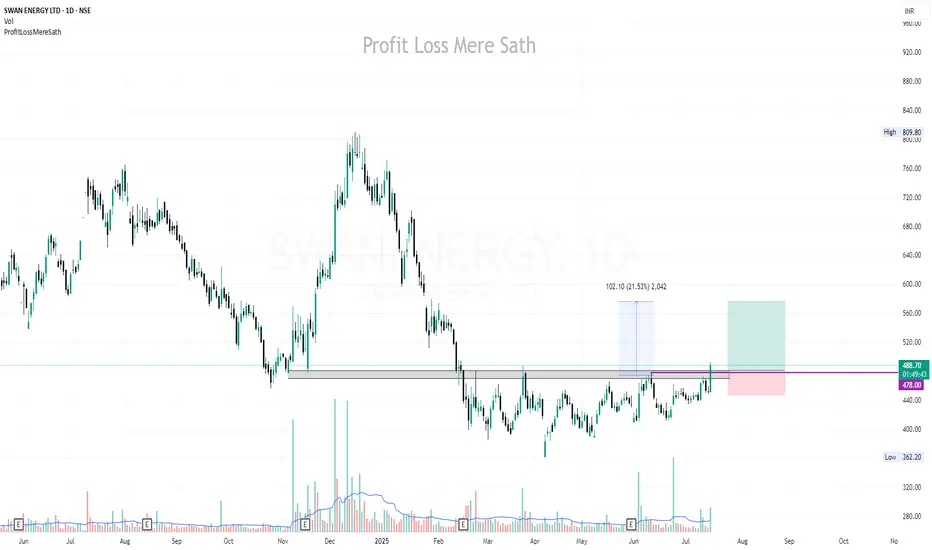
Swing trade monthly ...swan energy swan energy seem to be taking support at a major support level ....
this stock seem to be a swing long
23.90 INR
7.55 B INR
49.38 B INR
133.96 M
About SWAN ENERGY LTD
Sector
Industry
CEO
Nikhil Vasantlal Merchant
Website
Headquarters
Mumbai
Founded
1909
ISIN
INE665A01038
FIGI
BBG000D0RDV2
Swan Energy Ltd. engages in the development of real estate properties. It operates through the following segments: Textiles, Property Development, and Others. The company was founded on February 22 ,1909 and is headquartered in Mumbai, India.
Related stocks

Breakout in Swan Energy, Long TargetsA nice breakout in Swan Energy, if it breaks and sustains 490 then we can see a good up move from here.
Entry above 490
SL 485
Target1: 525
Target2: 550

SWANENERGY | Risk-Takers Buy @LTP, Safer Buy Above 480 closing..Disclaimer:
This is not financial advice. Please do your own research or consult with a financial advisor before making any investment decisions. Investments in stocks can be risky and may result in loss of capital.
SWANENERGYSWANENERGY
Support Range broken after a long consolidation with good volume, Poised for upward move, Target can be expected 500. 530, 550, 570 in a few weeks.
Stop Loss: 455
Note: For Long position maker, it is opportunity for you to grab this stock at the movement and wait for 600, 700, 800 in f

SWANENERGY LONG TERM ANALYSISThanks for stopping by.
All analysis here is done strictly from an investor’s perspective — focusing on risk, return, valuation, and potential upside.
The notes cover key details. I’ve backed every thesis with my own analysis — no fluff, just what matters to investors.
If you find the idea useful

swan energy This stock is showing power and coming days we cand expect a strong upmove .
Technically sl is very clear and stock is in momentum.


SWAN ENERGY LTD S/RSupport and Resistance Levels:
Support Levels: These are price points (green line/shade) where a downward trend may be halted due to a concentration of buying interest. Imagine them as a safety net where buyers step in, preventing further decline.
Resistance Levels: Conversely, resistance levels (re

Swan energy: Energised enough?Volumes indicating that we can expect a reversal, closing candle could have been better, now all depends on follow through. Strong close above 577 can open the upward gates. Fundamentally great company, upwards potential is high.

Swan Energy: Double Bottom Formation Suggests Potential ReversalThe chart is actually showing a double bottom pattern. This pattern is characterized by two consecutive low points, followed by a rebound.
Technical Analysis:
* Double Bottom: The formation of two similar low points suggests a potential reversal of a downtrend.
* Neckline: The line connecting the

See all ideas
Summarizing what the indicators are suggesting.
Oscillators
Neutral
SellBuy
Strong sellStrong buy
Strong sellSellNeutralBuyStrong buy
Oscillators
Neutral
SellBuy
Strong sellStrong buy
Strong sellSellNeutralBuyStrong buy
Summary
Neutral
SellBuy
Strong sellStrong buy
Strong sellSellNeutralBuyStrong buy
Summary
Neutral
SellBuy
Strong sellStrong buy
Strong sellSellNeutralBuyStrong buy
Summary
Neutral
SellBuy
Strong sellStrong buy
Strong sellSellNeutralBuyStrong buy
Moving Averages
Neutral
SellBuy
Strong sellStrong buy
Strong sellSellNeutralBuyStrong buy
Moving Averages
Neutral
SellBuy
Strong sellStrong buy
Strong sellSellNeutralBuyStrong buy
Displays a symbol's price movements over previous years to identify recurring trends.
Frequently Asked Questions
The current price of SWANENERGY is 442.80 INR — it has decreased by −5.24% in the past 24 hours. Watch SWAN ENERGY LTD stock price performance more closely on the chart.
Depending on the exchange, the stock ticker may vary. For instance, on NSE exchange SWAN ENERGY LTD stocks are traded under the ticker SWANENERGY.
SWANENERGY stock has fallen by −12.83% compared to the previous week, the month change is a 0.17% rise, over the last year SWAN ENERGY LTD has showed a −41.42% decrease.
SWANENERGY reached its all-time high on Dec 16, 2024 with the price of 809.80 INR, and its all-time low was 49.50 INR and was reached on Sep 6, 2013. View more price dynamics on SWANENERGY chart.
See other stocks reaching their highest and lowest prices.
See other stocks reaching their highest and lowest prices.
SWANENERGY stock is 6.41% volatile and has beta coefficient of 2.39. Track SWAN ENERGY LTD stock price on the chart and check out the list of the most volatile stocks — is SWAN ENERGY LTD there?
Today SWAN ENERGY LTD has the market capitalization of 138.88 B, it has increased by 11.64% over the last week.
Yes, you can track SWAN ENERGY LTD financials in yearly and quarterly reports right on TradingView.
SWANENERGY net income for the last quarter is −177.30 M INR, while the quarter before that showed 5.83 B INR of net income which accounts for −103.04% change. Track more SWAN ENERGY LTD financial stats to get the full picture.
Yes, SWANENERGY dividends are paid annually. The last dividend per share was 0.10 INR. As of today, Dividend Yield (TTM)% is 0.02%. Tracking SWAN ENERGY LTD dividends might help you take more informed decisions.
EBITDA measures a company's operating performance, its growth signifies an improvement in the efficiency of a company. SWAN ENERGY LTD EBITDA is −1.41 B INR, and current EBITDA margin is −2.86%. See more stats in SWAN ENERGY LTD financial statements.
Like other stocks, SWANENERGY shares are traded on stock exchanges, e.g. Nasdaq, Nyse, Euronext, and the easiest way to buy them is through an online stock broker. To do this, you need to open an account and follow a broker's procedures, then start trading. You can trade SWAN ENERGY LTD stock right from TradingView charts — choose your broker and connect to your account.
Investing in stocks requires a comprehensive research: you should carefully study all the available data, e.g. company's financials, related news, and its technical analysis. So SWAN ENERGY LTD technincal analysis shows the sell today, and its 1 week rating is sell. Since market conditions are prone to changes, it's worth looking a bit further into the future — according to the 1 month rating SWAN ENERGY LTD stock shows the neutral signal. See more of SWAN ENERGY LTD technicals for a more comprehensive analysis.
If you're still not sure, try looking for inspiration in our curated watchlists.
If you're still not sure, try looking for inspiration in our curated watchlists.