SWANENERGY trade ideas
SWANENERGYSWANENERGY
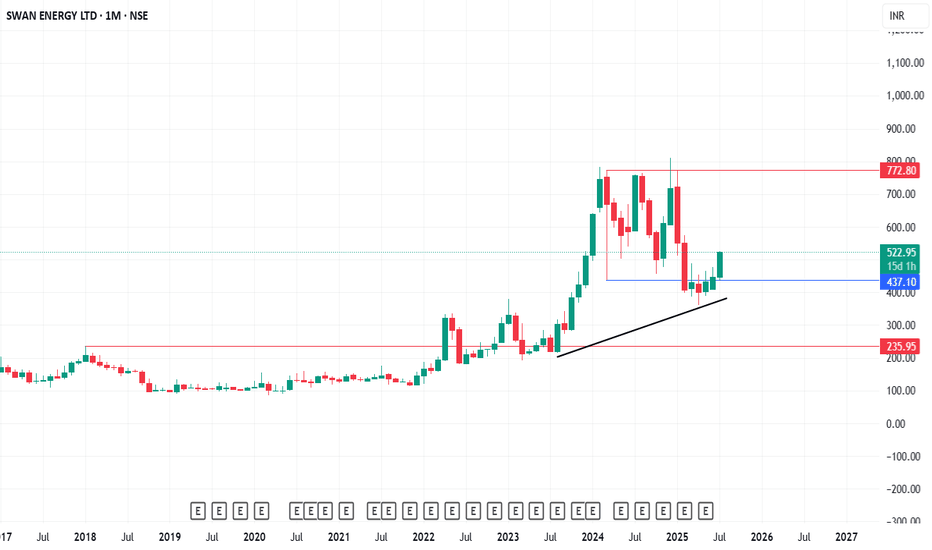
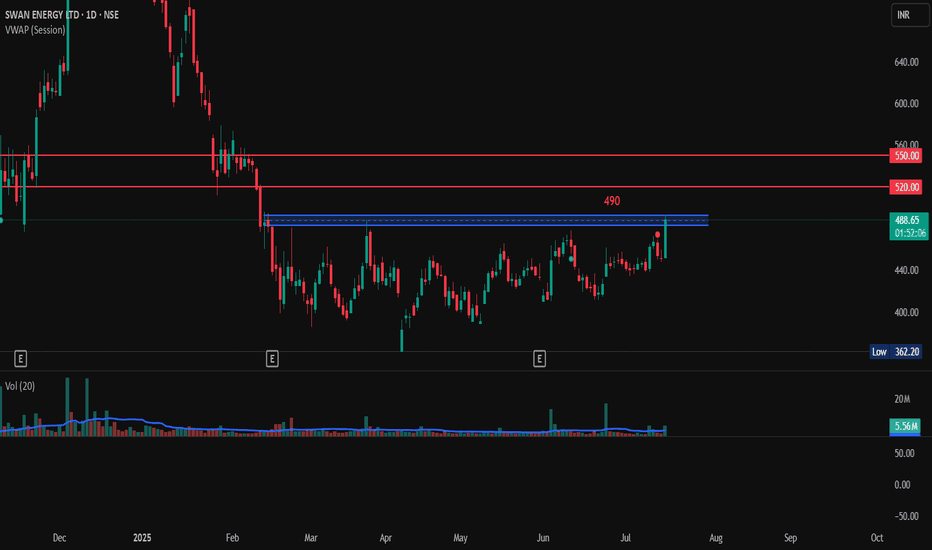
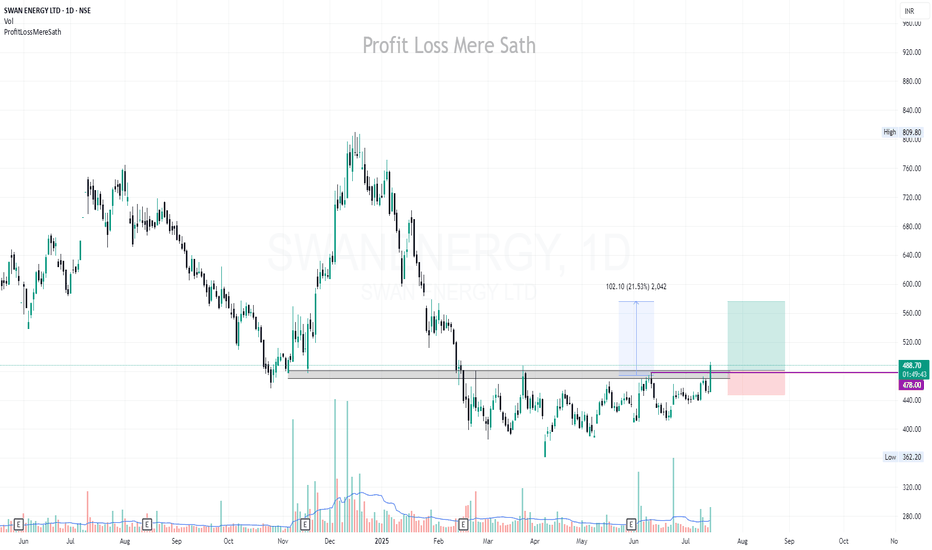
Support Range broken after a long consolidation with good volume, Poised for upward move, Target can be expected 500. 530, 550, 570 in a few weeks.
Stop Loss: 455
Note: For Long position maker, it is opportunity for you to grab this stock at the movement and wait for 600, 700, 800 in few month.
Happy Investing :)
SWANENERGY LONG TERM ANALYSISThanks for stopping by.
All analysis here is done strictly from an investor’s perspective — focusing on risk, return, valuation, and potential upside.
The notes cover key details. I’ve backed every thesis with my own analysis — no fluff, just what matters to investors.
If you find the idea useful or have suggestions, feel free to leave a comment. Always open to fresh insights.
Kind regards,
Psycho Trader
SWAN ENERGY LTD S/RSupport and Resistance Levels:
Support Levels: These are price points (green line/shade) where a downward trend may be halted due to a concentration of buying interest. Imagine them as a safety net where buyers step in, preventing further decline.
Resistance Levels: Conversely, resistance levels (red line/shade) are where upward trends might stall due to increased selling interest. They act like a ceiling where sellers come in to push prices down.
Breakouts:
Bullish Breakout: When the price moves above resistance, it often indicates strong buying interest and the potential for a continued uptrend. Traders may view this as a signal to buy or hold.
Bearish Breakout: When the price falls below support, it can signal strong selling interest and the potential for a continued downtrend. Traders might see this as a cue to sell or avoid buying.
20 EMA (Exponential Moving Average):
Above 20 EMA(50 EMA): If the stock price is above the 20 EMA, it suggests a potential uptrend or bullish momentum.
Below 20 EMA: If the stock price is below the 20 EMA, it indicates a potential downtrend or bearish momentum.
Trendline: A trendline is a straight line drawn on a chart to represent the general direction of a data point set.
Uptrend Line: Drawn by connecting the lows in an upward trend. Indicates that the price is moving higher over time. Acts as a support level, where prices tend to bounce upward.
Downtrend Line: Drawn by connecting the highs in a downward trend. Indicates that the price is moving lower over time. It acts as a resistance level, where prices tend to drop.
RSI: RSI readings greater than the 70 level are overbought territory, and RSI readings lower than the 30 level are considered oversold territory.
Combining RSI with Support and Resistance:
Support Level: This is a price level where a stock tends to find buying interest, preventing it from falling further. If RSI is showing an oversold condition (below 30) and the price is near or at a strong support level, it could be a good buy signal.
Resistance Level: This is a price level where a stock tends to find selling interest, preventing it from rising further. If RSI is showing an overbought condition (above 70) and the price is near or at a strong resistance level, it could be a signal to sell or short the asset.
Disclaimer:
I am not a SEBI registered. The information provided here is for learning purposes only and should not be interpreted as financial advice. Consider the broader market context and consult with a qualified financial advisor before making investment decisions.
Swan Energy: Double Bottom Formation Suggests Potential ReversalThe chart is actually showing a double bottom pattern. This pattern is characterized by two consecutive low points, followed by a rebound.
Technical Analysis:
* Double Bottom: The formation of two similar low points suggests a potential reversal of a downtrend.
* Neckline: The line connecting the highs between the two lows acts as a neckline. A breakout above the neckline could confirm the bullish reversal.
* Volume: The volume appears to be increasing during the formation of the double bottom, which is a bullish sign.
* Moving Average: The 50-day moving average (MA) is currently below the price, indicating a bullish bias. A break above the MA could further confirm the uptrend.
Trading Strategy:
* Wait for Breakout: A conservative approach would be to wait for a clear breakout above the neckline with increasing volume.
* Stop Loss: Place a stop loss below the recent low to limit potential losses.
* Target: The target could be based on the height of the double bottom or technical indicators like Fibonacci extensions.
SWANENERGY BREAKOUTSwan Energy Limited (SEL) was originally incorporated in 1909 as Swan Mills Ltd. (SML), a manufacturer and marketer of cotton and polyester textile products in India. Over the years, it has diversified into real estate and is developing a floating storage and regasification unit-based liquid natural gas (LNG) import terminal at Jafrabad in Gujarat.
FUNDAMENTALS
Pros
Strong sales growth of 249%.
Significant profit growth of 584%.
Good liquidity with a current ratio of 3.13.
Manageable debt with a debt-to-equity ratio of 0.55.
Diversified business into real estate and LNG.
Long-standing market presence since 1909.
Cons
High P/E ratio of 76.2, suggesting overvaluation.
Low dividend yield of 0.01%.
Modest return ratios: ROCE 8.28% and ROE 7.03%.
High price-to-book ratio of 3.65.
Total debt of ₹3,440 crore.
Exposure to industry volatility in the LNG sector.
Overall financial strength : 73/100
TECHNICALS
Prices are above 21, 50, 200 day EMA and 200 day MA.
Stock corrected nearly 40%+ from the top.
Weak Correction is suggesting that the supply is fading.
RSI : 63; indicating buying momentum.
MACD Crossover on Daily & Weekly time frame.
Stock was trading in a range for 4 months and finally broke out and retested the level of 680–665.
A teeny-tiny rounding bottom pattern formation.
ACTION
Above 750, it's a big base breakout, so one can capitalise on the momentum for a target of 795 (short-term positional).
For a little longer horizon, can hold it for 892.65 and 987 levels (fundamentally good company)
Aggressive traders can deploy small portion of capital above 750 if crosses with good volume spike.
Safe ones can wait for a retest at 747–755 level.
Now as per technical analysis, SL should be placed at around 645–650ish, but the RR isn't too fair for short term traders, so they can either place SL below the 21-day EMA.
This is just my analysis and research. I shall not be responsible for anyone's loss.
Happy Trading :)
#SWANENERGY 291 Tgt 30% Upside Recommended BUY - Rachit Sethia$NSE:SWANENERFY
#SWANENERGY 291
TGT 375
SL 270
TF < 6M
RR > 4
RETURN 30%
Factors: BULLISH WEDGE BREAKOUT Trend Following Rising Volume with rising Prices. Flag pattern breakout. Pennant Pattern Breakout with Bullish Candle. Retest Successful. Higher Highs & Higher Lows. Broken above RESISTANCE levels Trading at SUPPORT levels Earnings are strong. Bullish Wedge Breakout Risk Return Ratio is healthy. And Rising from Double Bottom Pattern to Flag Pattern forming. If you like my work KINDLY LIKE SHARE & FOLLOW this page for free Stock Recommendations. With 💚 from Rachit Sethia
SWANENERGY - Bullish Swing ReversalNSE: SWANENERGY is closing with a bullish swing reversal candle supported with volumes.
Today's volumes and candlestick formation indicates strong demand and stock should move to previous swing highs in the coming days.
The stock has been moving along the horizontal support for the past few days which is indicating demand.
One can look for a 8% to 13% gain on deployed capital in this swing trade.
The view is to be discarded in the event of the stock breaking previous swing low.
#NSEindia #Trading #StockMarketindia #Tradingview #SwingTrade


