SYNGENE INTERNATIONALSyngene International Ltd. is a leading integrated research, development, and manufacturing services company, primarily serving global pharmaceutical, biotechnology, and agrochemical sectors. It offers discovery, development, and scale-up solutions under the contract research organization (CRO) and
Next report date
—
Report period
—
EPS estimate
—
Revenue estimate
—
12.65 INR
4.96 B INR
36.36 B INR
188.89 M
About SYNGENE INTERNATIONAL LTD
Sector
CEO
Peter James Jonathan Bains
Website
Headquarters
Bangalore
Founded
1993
ISIN
INE398R01022
FIGI
BBG008KWGR11
Syngene International Ltd. operates as a global discovery, development and manufacturing organization providing integrated scientific services to the pharmaceutical, biotechnology, nutrition, animal health, consumer goods and specialty chemical industries. It is engaged providing contract research and manufacturing services. The firm’s services include discovery chemistry, discovery biology, safety assessment, large molecule development, chemical development, formulation development, stability studies, polymer research, integrated discovery and development, and clinical development. The company was founded on November 18, 1993 and is headquartered in Bangalore, India.
Related stocks
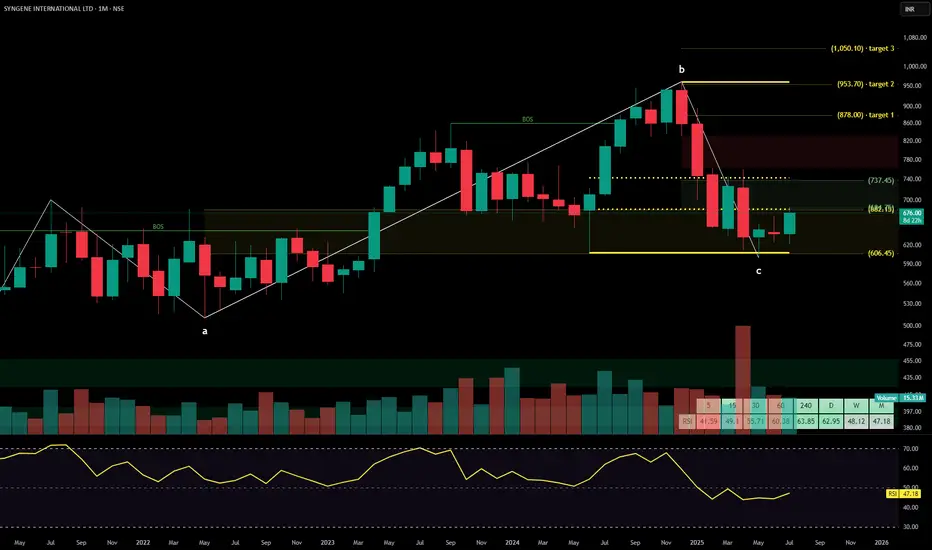
SYNGENE INTERNATIONAL LTD at Old Peaks Key Support 📈 Monthly Chart – Key Support at Old Peaks
The stock has recently revisited the ₹600–₹610 range, which corresponds to a previous consolidation and monthly swing-low zone (~₹607) from November 2020 to April 2023 on the monthly timeframe
This zone isn’t just another support level—it represents an
Syngene International BuySyngene International seems to take resistance at channel top, forming lower high. Sell @CMP (640) with SL of 655 and target of 600 and 550.

Syngene Industries - Long SetUpNSE:SYNGENE
𝐒𝐲𝐧𝐠𝐞𝐧𝐞 𝐈𝐧𝐭𝐞𝐫𝐧𝐚𝐭𝐢𝐨𝐧𝐚𝐥
𝐄𝐧𝐭𝐫𝐘 Between 615 -- 630
𝐒𝐋 Below 600 (Swing Low)
𝐓𝐚𝐫𝐠𝐞𝐭 - 680 , 700+

Make or Break Levels in Syngene International LtdFuture Stoch
Pharma Sector
Syngene International Ltd
Make or Break levels in Syngene International Ltd's technical chart.
Supports & Patterns Spotted:
Parallel Channel
Rising Wedge Pattern
Support Zone
Anchored VWAP
Volume Profile
Law Of Polarity
600 & 570 are good Support levels.
Note: This anal

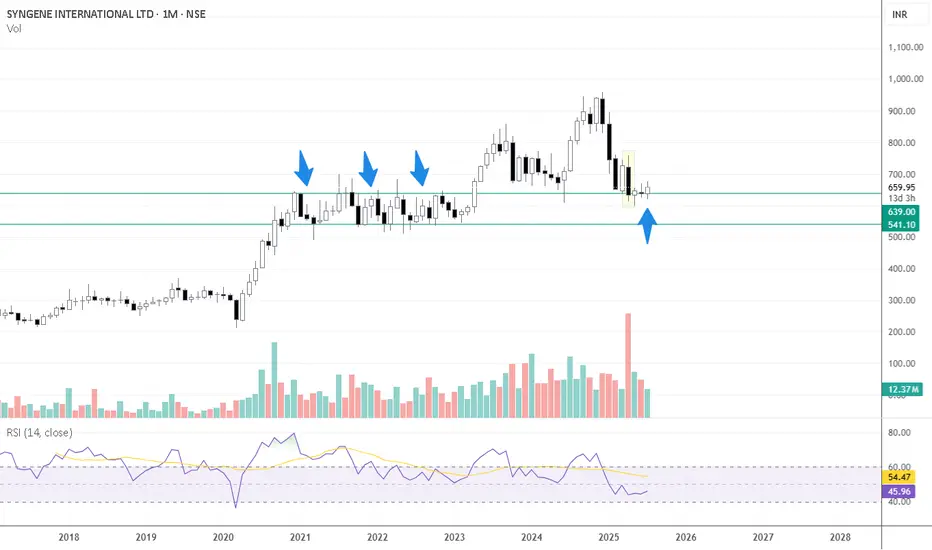
Syngene International Ltd – Key Technical Zone Identified! Big O🔍 SYNGENE International Ltd – Key Technical Zone Identified! Big Opportunity Brewing 🔥
📉 Context & Background:
Syngene International has seen a 36% correction from its all-time high, recently making a low of ₹612.25. This decline brings the price close to a crucial historical support area — the mo

SYNGENE📉 **Possible Reversal for SYNGENE?**
The **SYNGENE International Ltd (NSE) daily chart** suggests a potential **bullish reversal** or **continued bearish trend**, depending on key price action around the support level. Here are the key insights:
🔹 **Support Zone:** The stock is holding near **

Made all time highs, consolidated and buyers entered W, D looks great! Took fib entry cause there are only buyers in the market

Catching Intraday Trades like a PRO!!Hows the Josh?
High, sir!
--------------
Attaching today's intraday positions, all in profit, for your motivation.
Have a great weekend, wonderful people!
Stay strong!

Syngene International Ltd. - Long Setup (Swing Trade)Syngene International Ltd. has confirmed a breakout above the entry zone, offering a potential swing trade setup.
Here’s the trade plan:
Entry Price: 897.90 (Confirmed after the 15-minute candle broke above the entry zone at 895)
Target: 1027.90
Stop Loss: 828.65 (Stop loss will be trig

See all ideas
Summarizing what the indicators are suggesting.
Neutral
SellBuy
Strong sellStrong buy
Strong sellSellNeutralBuyStrong buy
Neutral
SellBuy
Strong sellStrong buy
Strong sellSellNeutralBuyStrong buy
Neutral
SellBuy
Strong sellStrong buy
Strong sellSellNeutralBuyStrong buy
An aggregate view of professional's ratings.
Neutral
SellBuy
Strong sellStrong buy
Strong sellSellNeutralBuyStrong buy
Neutral
SellBuy
Strong sellStrong buy
Strong sellSellNeutralBuyStrong buy
Neutral
SellBuy
Strong sellStrong buy
Strong sellSellNeutralBuyStrong buy
Displays a symbol's price movements over previous years to identify recurring trends.
Frequently Asked Questions
The current price of SYNGENE is 703.25 INR — it has decreased by −1.51% in the past 24 hours. Watch SYNGENE INTERNATIONAL LTD stock price performance more closely on the chart.
Depending on the exchange, the stock ticker may vary. For instance, on NSE exchange SYNGENE INTERNATIONAL LTD stocks are traded under the ticker SYNGENE.
SYNGENE stock has risen by 5.37% compared to the previous week, the month change is a 10.54% rise, over the last year SYNGENE INTERNATIONAL LTD has showed a −12.94% decrease.
We've gathered analysts' opinions on SYNGENE INTERNATIONAL LTD future price: according to them, SYNGENE price has a max estimate of 840.00 INR and a min estimate of 580.00 INR. Watch SYNGENE chart and read a more detailed SYNGENE INTERNATIONAL LTD stock forecast: see what analysts think of SYNGENE INTERNATIONAL LTD and suggest that you do with its stocks.
SYNGENE reached its all-time high on Dec 2, 2024 with the price of 960.60 INR, and its all-time low was 147.50 INR and was reached on Aug 11, 2015. View more price dynamics on SYNGENE chart.
See other stocks reaching their highest and lowest prices.
See other stocks reaching their highest and lowest prices.
SYNGENE stock is 2.03% volatile and has beta coefficient of 0.62. Track SYNGENE INTERNATIONAL LTD stock price on the chart and check out the list of the most volatile stocks — is SYNGENE INTERNATIONAL LTD there?
Today SYNGENE INTERNATIONAL LTD has the market capitalization of 281.90 B, it has increased by 5.28% over the last week.
Yes, you can track SYNGENE INTERNATIONAL LTD financials in yearly and quarterly reports right on TradingView.
SYNGENE INTERNATIONAL LTD is going to release the next earnings report on Oct 22, 2025. Keep track of upcoming events with our Earnings Calendar.
SYNGENE earnings for the last quarter are 2.11 INR per share, whereas the estimation was 1.59 INR resulting in a 32.70% surprise. The estimated earnings for the next quarter are 2.00 INR per share. See more details about SYNGENE INTERNATIONAL LTD earnings.
SYNGENE INTERNATIONAL LTD revenue for the last quarter amounts to 8.74 B INR, despite the estimated figure of 8.47 B INR. In the next quarter, revenue is expected to reach 9.27 B INR.
SYNGENE net income for the last quarter is 867.00 M INR, while the quarter before that showed 1.83 B INR of net income which accounts for −52.70% change. Track more SYNGENE INTERNATIONAL LTD financial stats to get the full picture.
Yes, SYNGENE dividends are paid annually. The last dividend per share was 1.25 INR. As of today, Dividend Yield (TTM)% is 0.18%. Tracking SYNGENE INTERNATIONAL LTD dividends might help you take more informed decisions.
SYNGENE INTERNATIONAL LTD dividend yield was 0.17% in 2024, and payout ratio reached 10.13%. The year before the numbers were 0.18% and 9.84% correspondingly. See high-dividend stocks and find more opportunities for your portfolio.
As of Aug 2, 2025, the company has 8.23 K employees. See our rating of the largest employees — is SYNGENE INTERNATIONAL LTD on this list?
EBITDA measures a company's operating performance, its growth signifies an improvement in the efficiency of a company. SYNGENE INTERNATIONAL LTD EBITDA is 10.82 B INR, and current EBITDA margin is 29.01%. See more stats in SYNGENE INTERNATIONAL LTD financial statements.
Like other stocks, SYNGENE shares are traded on stock exchanges, e.g. Nasdaq, Nyse, Euronext, and the easiest way to buy them is through an online stock broker. To do this, you need to open an account and follow a broker's procedures, then start trading. You can trade SYNGENE INTERNATIONAL LTD stock right from TradingView charts — choose your broker and connect to your account.
Investing in stocks requires a comprehensive research: you should carefully study all the available data, e.g. company's financials, related news, and its technical analysis. So SYNGENE INTERNATIONAL LTD technincal analysis shows the buy rating today, and its 1 week rating is buy. Since market conditions are prone to changes, it's worth looking a bit further into the future — according to the 1 month rating SYNGENE INTERNATIONAL LTD stock shows the neutral signal. See more of SYNGENE INTERNATIONAL LTD technicals for a more comprehensive analysis.
If you're still not sure, try looking for inspiration in our curated watchlists.
If you're still not sure, try looking for inspiration in our curated watchlists.