SYNGENE INTERNATIONALSyngene International Ltd. is a leading integrated research, development, and manufacturing services company, primarily serving global pharmaceutical, biotechnology, and agrochemical sectors. It offers discovery, development, and scale-up solutions under the contract research organization (CRO) and contract development and manufacturing organization (CDMO) models. The stock is currently trading at ₹676.00.
Syngene International Ltd. – FY22–FY25 Snapshot
Sales – ₹2,677 Cr → ₹3,135 Cr → ₹3,554 Cr → ₹3,964 Cr – Consistent topline growth driven by increased contracts Net Profit – ₹438 Cr → ₹514 Cr → ₹588 Cr → ₹667 Cr – Margins expanding with operational leverage in discovery and manufacturing services
Company Order Book – Moderate → Strong → Strong → Strong – High visibility from multiyear contracts
Dividend Yield (%) – 0.36% → 0.38% → 0.41% → 0.45% – Growing but modest payouts, prioritizing reinvestment Operating Performance – Moderate → Strong → Strong → Strong – Capacity utilization and cost control boosting
Equity Capital – ₹40.26 Cr (constant) – Stable capital structure
Total Debt – ₹325 Cr → ₹298 Cr → ₹270 Cr → ₹245 Cr – Gradual deleveraging in line with internal accruals
Total Liabilities – ₹1,310 Cr → ₹1,365 Cr → ₹1,430 Cr → ₹1,495 Cr – Stable expansion aligned with service delivery scale
Fixed Assets – ₹1,225 Cr → ₹1,280 Cr → ₹1,335 Cr → ₹1,390 Cr – Capex toward lab infra and cGMP manufacturing
Latest Highlights FY25 net profit rose 13.4% YoY to ₹667 Cr; revenue increased 11.5% to ₹3,964 Cr EPS: ₹16.57 | EBITDA Margin: 29.1% | Net Margin: 16.83% Return on Equity: 18.74% | Return on Assets: 12.94% Promoter holding: 54.36% | Dividend Yield: 0.45% Renewals from top pharma clients and expansion into ADC (antibody-drug conjugate) platforms Clinical trial support and molecule scale-up seeing higher global demand
Institutional Interest & Ownership Trends Promoter holding remains stable at 54.36%, with no pledging or dilution. FII participation has increased marginally post Q4 results, while domestic institutions maintain steady exposure. Delivery volumes indicate quiet accumulation from long-only funds with global CRO/CDMO themes.
Business Growth Verdict Yes, Syngene is scaling effectively across discovery and manufacturing services Margins are holding firm with diversified client and geography mix Debt reduction and capex efficiency indicate disciplined expansion High contract renewal rates and scientific capabilities boost visibility
Company Guidance Management expects FY26 growth to remain in low double digits, driven by molecule scale-ups and biologics manufacturing. Focus remains on increasing capacity utilization and expanding service depth across verticals.
Final Investment Verdict Syngene International Ltd. represents a durable compounder in India’s life sciences ecosystem. With strong partnerships, growing demand for outsourced research, and operational excellence, the company is positioned for long-term value creation. Its capital discipline, client stickiness, and technological depth make it attractive for accumulation by investors seeking exposure to high-margin, innovation-led pharma services.
SYNGENE trade ideas
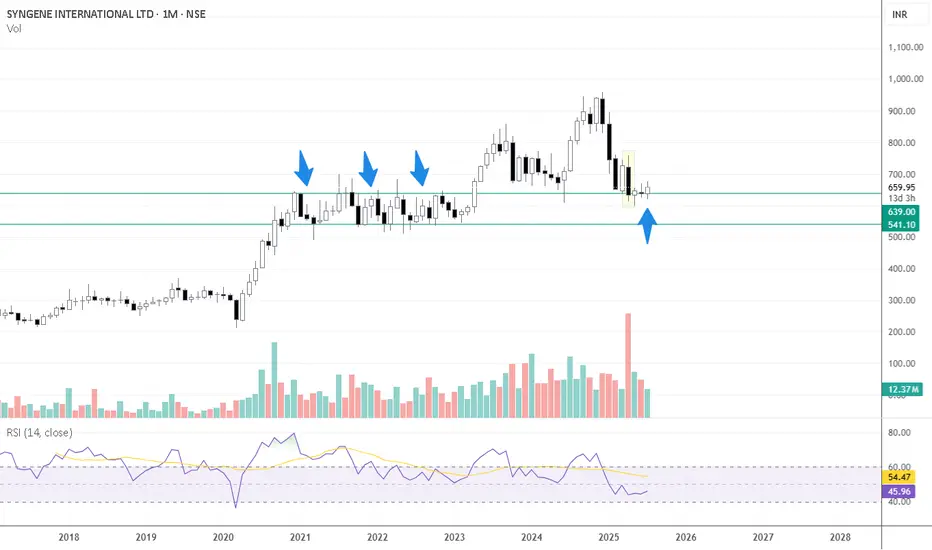
SYNGENE INTERNATIONAL LTD at Old Peaks Key Support 📈 Monthly Chart – Key Support at Old Peaks
The stock has recently revisited the ₹600–₹610 range, which corresponds to a previous consolidation and monthly swing-low zone (~₹607) from November 2020 to April 2023 on the monthly timeframe
This zone isn’t just another support level—it represents an area where price historically spent over 2.5 years, making multiple tests before breaking higher. Such zones often act as strong demand zones when revisited
A sustained hold above ₹607 would reinforce this support, signaling a potential base for a multi-month reversal or bounce
🕯️ April Monthly Candle – Selling Exhaustion?
Large bearish candle in April (FY25 Q4 results month).
High volume, which often signals capitulation or Selling climax.
Price has since stayed within the range of this candle-no breakout above or below.
Indicates a potential exhaustion of sellers if the stock holds above the low of that candle, this structure often represents a volatility compression after a sharp move-like a spring coiling.
Syngene International BuySyngene International seems to take resistance at channel top, forming lower high. Sell @CMP (640) with SL of 655 and target of 600 and 550.

Syngene Industries - Long SetUpNSE:SYNGENE
𝐒𝐲𝐧𝐠𝐞𝐧𝐞 𝐈𝐧𝐭𝐞𝐫𝐧𝐚𝐭𝐢𝐨𝐧𝐚𝐥
𝐄𝐧𝐭𝐫𝐘 Between 615 -- 630
𝐒𝐋 Below 600 (Swing Low)
𝐓𝐚𝐫𝐠𝐞𝐭 - 680 , 700+

Make or Break Levels in Syngene International LtdFuture Stoch
Pharma Sector
Syngene International Ltd
Make or Break levels in Syngene International Ltd's technical chart.
Supports & Patterns Spotted:
Parallel Channel
Rising Wedge Pattern
Support Zone
Anchored VWAP
Volume Profile
Law Of Polarity
600 & 570 are good Support levels.
Note: This analysis is for educational purposes only and is not intended as a recommendation or trading advice

Syngene International Ltd – Key Technical Zone Identified! Big O🔍 SYNGENE International Ltd – Key Technical Zone Identified! Big Opportunity Brewing 🔥
📉 Context & Background:
Syngene International has seen a 36% correction from its all-time high, recently making a low of ₹612.25. This decline brings the price close to a crucial historical support area — the monthly swing low at ₹607.
Here's what caught our attention:
Between Nov 2020 and April 2023, the stock spent nearly 2.5 years consolidating around this same zone.
Now, price is revisiting this region again — and such zones rarely break without a fight.
This makes it a high-interest area where smart money could step back in.
🧠 Trade Thesis:
If the price breaks below ₹607, it opens the door to a deeper liquidity sweep — and the entry zone becomes:
✅ Entry Zone: ₹601 – ₹568
This is where we expect a sharp bounce-back, supported by the long-term price memory and previous consolidation.
🛡️ Stop-Loss: ₹530
This level is placed safely below the base of this zone, in case structure fails.
🎯 Profit Targets:
Target 1: ₹650
Target 2: ₹720
Short- to swing-term upside potential is solid with a favorable risk-to-reward ratio.
⚠️ Aggressive Trader's Option:
If you're experienced and can manage risk well, you may look to enter right after the monthly swing low (₹607) is breached, with tight control over your position sizing.
🧭 Why This Zone is Critical:
Price has touched this region multiple times over years, and acted as a major demand zone.
After a 36% correction, it's now at an area of maximum potential support.
Chances of price bouncing from this area are high, unless there's a major fundamental breakdown — which currently isn't visible.
🧠 Summary Table:
Component Details
Entry Zone ₹601 – ₹568
Stop-Loss ₹530
Target 1 ₹650
Target 2 ₹720
Strategy Type Swing / Short-Term Trade
Risk Level Moderate to Low (zone-based entry)
🔔 What Led Us to Post This Update?
Price near a long-term demand base (monthly low)
36% correction offers value
Technical history shows strong bounce potential
Structure still intact — not a panic drop
Setups like these offer limited risk and good upside for patient traders
📢 Don’t Miss Out!
✅ Make sure to follow me so you don’t miss my next analysis!
👍 Drop a like if you found this helpful and leave a comment with your thoughts!
💬 Let’s chat in the comment section. See you there! 🚀📊
🙏 Thanks for your continued support. Let’s grow together!

SYNGENE📉 **Possible Reversal for SYNGENE?**
The **SYNGENE International Ltd (NSE) daily chart** suggests a potential **bullish reversal** or **continued bearish trend**, depending on key price action around the support level. Here are the key insights:
🔹 **Support Zone:** The stock is holding near **660 - 668 INR**, a historically significant level.
🔹 **Bounce or Breakdown?** A clear break below this zone could lead to further downside toward **640 - 620 INR**, while a bounce may push it higher.
🔹 **Moving Average Factor:** The price is still below the **50-day moving average**, indicating a downtrend, but a reversal could occur if it reclaims this level.
🔹 **Risk-Reward Setup:** A long trade from **660 INR** targeting **700 INR** offers a decent risk-to-reward ratio, while a breakdown trade could target **640 INR**.
💡 **Bullish Scenario:** If support holds, SYNGENE could bounce back toward **700 - 720 INR** in the coming sessions.
⚠️ **Bearish Risk:** A breakdown below **660 INR** may lead to further declines, continuing the downtrend.
📊 **Overall Sentiment: Watch for Reversal or Breakdown ⚖️**

Made all time highs, consolidated and buyers entered W, D looks great! Took fib entry cause there are only buyers in the market

Catching Intraday Trades like a PRO!!Hows the Josh?
High, sir!
--------------
Attaching today's intraday positions, all in profit, for your motivation.
Have a great weekend, wonderful people!
Stay strong!

Syngene International Ltd. - Long Setup (Swing Trade)Syngene International Ltd. has confirmed a breakout above the entry zone, offering a potential swing trade setup.
Here’s the trade plan:
Entry Price: 897.90 (Confirmed after the 15-minute candle broke above the entry zone at 895)
Target: 1027.90
Stop Loss: 828.65 (Stop loss will be triggered if a daily candle closes below this level)
With the entry price confirmed at 897.90 , the setup offers a favorable risk-to-reward ratio. The stock is targeting a move toward 1027.90 , with a well-defined stop loss at 828.65 to manage risk.
Disclaimer: This post is for educational purposes only and is not financial advice. Always manage your risk and trade responsibly.

SYNGENE S/R Support and Resistance Levels:
Support Levels: These are price points (green line/shade) where a downward trend may be halted due to a concentration of buying interest. Imagine them as a safety net where buyers step in, preventing further decline.
Resistance Levels: Conversely, resistance levels (red line/shade) are where upward trends might stall due to increased selling interest. They act like a ceiling where sellers come in to push prices down.
Breakouts:
Bullish Breakout: When the price moves above resistance, it often indicates strong buying interest and the potential for a continued uptrend. Traders may view this as a signal to buy or hold.
Bearish Breakout: When the price falls below support, it can signal strong selling interest and the potential for a continued downtrend. Traders might see this as a cue to sell or avoid buying.
20 EMA (Exponential Moving Average):
Above 20 EMA(50 EMA): If the stock price is above the 20 EMA, it suggests a potential uptrend or bullish momentum.
Below 20 EMA: If the stock price is below the 20 EMA, it indicates a potential downtrend or bearish momentum.
Trendline: A trendline is a straight line drawn on a chart to represent the general direction of a data point set.
Uptrend Line: Drawn by connecting the lows in an upward trend. Indicates that the price is moving higher over time. Acts as a support level, where prices tend to bounce upward.
Downtrend Line: Drawn by connecting the highs in a downward trend. Indicates that the price is moving lower over time. It acts as a resistance level, where prices tend to drop.
RSI: RSI readings greater than the 70 level are overbought territory, and RSI readings lower than the 30 level are considered oversold territory.
Combining RSI with Support and Resistance:
Support Level: This is a price level where a stock tends to find buying interest, preventing it from falling further. If RSI is showing an oversold condition (below 30) and the price is near or at a strong support level, it could be a good buy signal.
Resistance Level: This is a price level where a stock tends to find selling interest, preventing it from rising further. If RSI is showing an overbought condition (above 70) and the price is near or at a strong resistance level, it could be a signal to sell or short the asset.
Disclaimer:
I am not a SEBI registered. The information provided here is for learning purposes only and should not be interpreted as financial advice. Consider the broader market context and consult with a qualified financial advisor before making investment decisions.

50 SMA Rising- Positional TradeDisclaimer: I am not a Sebi registered adviser.
This Idea is publish purely for educational purpose only before investing in any stocks please take advise from your financial adviser.
Its 50 SMA Rising Strategy. Suitable for Positional Trading Initial Stop loss lowest of last 2 candles and keep trailing with 50 days SMA if price close below 50 SMA then Exit or be in the trade some time trade can go for several months.
Be Discipline because discipline is the Key to Success in the STOCK Market.
Trade What you see not what you Think

SYNGENEHello friends today we will show you a new stock is hitting support and making a hammer on daily time frame

Syngene International Ltd view for Intraday 1st October #SYNGENESyngene International Ltd view for Intraday 1st October #SYNGENE
Buying may witness above 903
Support area 890. Below ignoring buying momentum for intraday
Selling may witness below 892
Resistance area 900
Above ignoring selling momentum for intraday
Charts for Educational purposes only.
Please follow strict stop loss and risk reward if you follow the level.
Thanks,
V Trade Point

syngene bo!A well potential stock
Bo from flag pattern after goood consolidation
expecting a rally
Green lines are target
Red line stop loss for swing trade

SYNGENEHi guys, In this chart i Found a Demand Zone in SYNGENE CHART for LONG entry,
Observed these Levels based on price action and Demand & Supply.
*Don't Take any trades based on this Picture.
... because this chart is for educational purpose only not for Buy or Sell Recommendation..
Thank you

break outSure! Here's a fun, visually engaging explanation of the pattern and setup for social media using emojis and a clean structure:
---
📊 **Syngene International Ltd. - Head & Shoulders Pattern Breakdown** 💡
🔍 **Pattern**: Head & Shoulders (Bullish Breakout)
- 👕 **Left Shoulder**: Price forms a peak.
- 🧢 **Head**: A higher peak, followed by a decline.
- 👕 **Right Shoulder**: A lower peak, matching the left shoulder.
💥 **Breakout**: The price broke **above the neckline** (₹860), signaling a bullish reversal 🚀!
📈 **Last 5 Candles**:
1️⃣ Big green candle 📈 — Strong buying momentum!
2️⃣ Continued rise 📉 — Steady upward pressure.
3️⃣ Smaller candle 🔼 — Trend continues.
4️⃣ Small pause 💬 — Brief consolidation.
5️⃣ Another spike 📊 — Bulls taking over with high volume!
---
🔑 **Target**:
🟢 **₹1,094** (Measured move from head to neckline projected upwards)
🔐 **Stop-Loss**:
🔴 **₹843-₹845** (2% below the neckline for safety)
📢 **Summary**:
🔥 Bullish breakout confirmed with volume spikes!
🎯 Target ₹1,094 📊 | 🛑 Stop-loss at ₹843.
---
Here’s a creative way to encourage your audience to **like**, **subscribe**, and **share** using the same fun style:
---
🔥 **Enjoyed the analysis?** 🔥
👉 Don’t forget to **LIKE** this post if you found it helpful! 👍
👀 Want more updates like this? **SUBSCRIBE** to stay in the loop! 🔔
🙌 **SHARE** with your fellow traders and friends! 🤝
---
📊 **Stay ahead of the market trends** with more patterns, tips, and insights! 📈
💬 **Comment below** if you’ve got questions, or want to see more stock analyses! 🧐
Thanks for your support! Let’s keep growing together 🚀
---
This keeps the tone light, fun, and engaging for your audience to interact! 😊

Syngene-LongSyngene- Looking good for a retest and fly. It has formed a Symmetric Triangle Chart Pattern in 4hrs time frame. We can expect a target of 825 and if it cross then all time high.
Disc: Only for learning purpose and not a trading recommendation.

SYNGENE - Gearing up for higher MoveThe stock after nearly 10 months of consolidation had come out of the consolidation zone and now it is attempting to take out the previous supply zone as well. As we can see in the weekly chart, the relative strength and the money flow index are positive. In the daily chart as well, you can find the relative strength, the buying pressure are all positive. However, the money flow has not picked up. Given these conditions, once the money flow also picks up, the stock is likely to go up higher after breaking out of the price rejection zone or the supply zone. A positive close above 858 level, will add to the conviction.

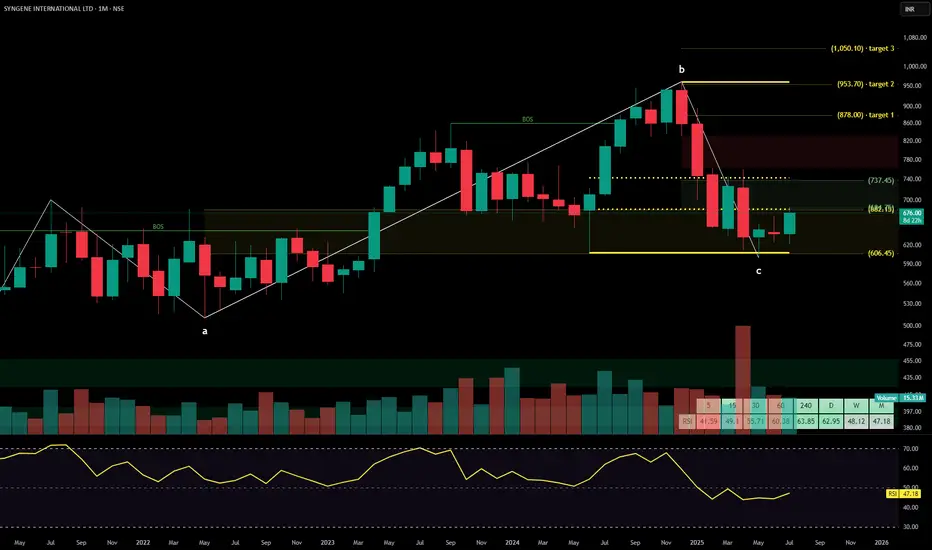
SYNGENE ON TO 1000CMP of the stock is 707 and the stock is in excellent re-accumlation phase holding abv the trendline and demand zone on the monthly time frame.
Considering the time frame of trade, the stock could witness rally to 1000 as long as it stays abv 600 which gives us a risk reward of 1:3
Disclaimer: This idea is for informational purpose only and is not a buy or sell recommendation

SYNGENE Channel Pattern Breakout ?This looks like a channel pattern breakout in SYNGENE
Strong Support.
Breakout on the resistance line.
There is another resistance line at 9%
Inverter hammer candle appearance

SYNGENE - Engines Onn ??🎯The chart is self-explanatory as always.
🎯 The price has been in a range bound momentum for a while
🎯 A breakout is now followed by a consolidation with precise resistance and support
🎯 We may see a rebound from here
⚠️Disclaimer: We are not registered advisors. The views expressed here are merely personal opinions. Irrespective of the language used, Nothing mentioned here should be considered as advice or recommendation. Please consult with your financial advisors before making any investment decisions. Like everybody else, we too can be wrong at times.
can we consider this as W shape requesting any one please reveiw and suggest is it considerable W pattern in charts. Trying to understand chart patterns.
