Tanla platforms getting ready for the next phase of growth ? At the trend line. Price has done nothing since 2022. Company is buying back shares and announced new AI based solutions being rolled out. Chart looking interesting. Wait for a break above trend and the 200 EMA.
Next report date
—
Report period
—
EPS estimate
—
Revenue estimate
—
36.00 INR
5.07 B INR
40.28 B INR
63.29 M
About TANLA PLATFORMS LTD
Sector
Industry
CEO
Uday Kumar Reddy Dasari
Website
Headquarters
Hyderabad
Founded
1995
ISIN
INE483C01032
FIGI
BBG000HRBCS2
Tanla Platforms Ltd. is a cloud communication provider, which engages in information technology and computer services. Its products include messaging, voice, and Internet of things. It operates through the India and Rest of the World geographical segments. The company was founded by Uday Kumar Reddy Dasari on July 28, 1995 and is headquartered in Hyderabad, India.
Related stocks

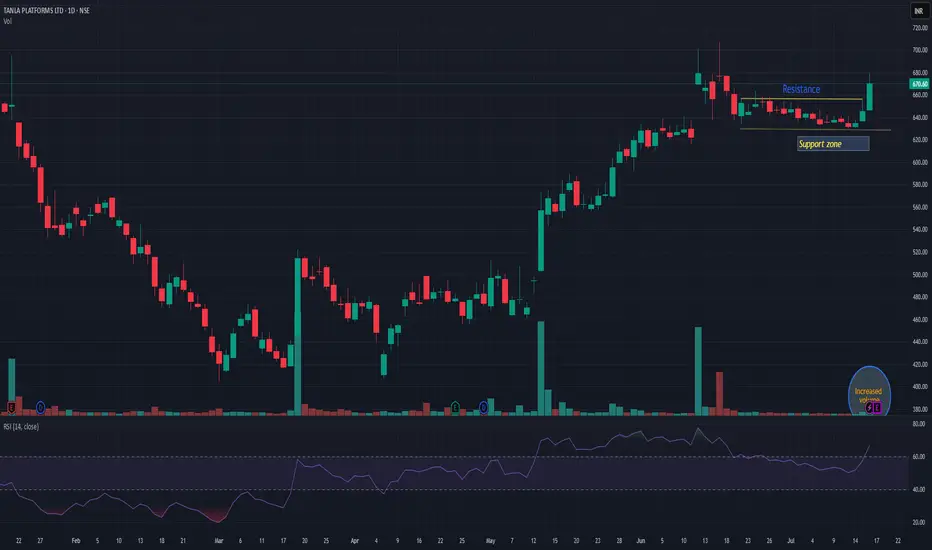
TANLATANLA giving resistance breakout with decent volume. Seems it may start momentum from here. 625-30 is strong support zone. below this my view may be changed. Risk-reward is quite in favor.
Tanla platform change Direction for upside seen 1000Tanla platform change Direction for upside seen possible target 819-1065-1310 cmp. 675 self investor trade above 711 stoploss 478

TANLA PLATFORMS LTD S/RSupport and Resistance Levels:
Support Levels: These are price points (green line/shade) where a downward trend may be halted due to a concentration of buying interest. Imagine them as a safety net where buyers step in, preventing further decline.
Resistance Levels: Conversely, resistance levels (re

Signs of Reversal in Tanla PlatformHey Guys,
The following is the details of the analysis:
Wave 1, 2, and 3 Completion:
Wave 1 marks the initial move after the reversal.
Wave 2 is a corrective pullback.
Wave 3 is the subsequent strong move in the trend direction. In Elliott Wave Theory, Wave 3 is often the longest and strongest

TANLATANLA Reversal expected below level.
*I am Not SEBI Registered. This is Purely Education purpose Only.

TANLA: An underdogFundamentally sound company; small-cap with highly positive cash-flows.
On technical charts, High volume trading on the buying side with long term consolidation is seen.
Highly bullish on this stock

Volume Breakout - Swing TradeDisclaimer: I am not a Sebi registered adviser.
This Idea is publish purely for educational purpose only before investing in any stocks please take advise from your financial adviser.
Volume Breakout. Stock has give Breakout with Volume. Keep in watch list. Buy above the high. Suitable for Swing Tr

BUY TANLA @ CURRENT MARKET PRICEOne can Buy Tanla at the current market rate of 700 to 710. All the Time frames have made HL and have retested the levels of 700. The indicators. RSI Divergence show oversold territory. The stock has potential to test the level of 750 to 762 in short term and one can go long on the stock for the tar

a strong contender for a good pullback NSE:TANLA my targets for a fresh position here is 858 just check the fundamentals of this company and if u have any doubts comment below i will provide the fundamentals in comment section this is technical pullback position update but this stock is value buy at this time

See all ideas
Summarizing what the indicators are suggesting.
Neutral
SellBuy
Strong sellStrong buy
Strong sellSellNeutralBuyStrong buy
Neutral
SellBuy
Strong sellStrong buy
Strong sellSellNeutralBuyStrong buy
Neutral
SellBuy
Strong sellStrong buy
Strong sellSellNeutralBuyStrong buy
An aggregate view of professional's ratings.
Neutral
SellBuy
Strong sellStrong buy
Strong sellSellNeutralBuyStrong buy
Neutral
SellBuy
Strong sellStrong buy
Strong sellSellNeutralBuyStrong buy
Neutral
SellBuy
Strong sellStrong buy
Strong sellSellNeutralBuyStrong buy
Displays a symbol's price movements over previous years to identify recurring trends.
Frequently Asked Questions
The current price of TANLA is 648.90 INR — it has decreased by −4.10% in the past 24 hours. Watch TANLA PLATFORMS LTD stock price performance more closely on the chart.
Depending on the exchange, the stock ticker may vary. For instance, on NSE exchange TANLA PLATFORMS LTD stocks are traded under the ticker TANLA.
TANLA stock has fallen by −1.20% compared to the previous week, the month change is a −0.78% fall, over the last year TANLA PLATFORMS LTD has showed a −30.97% decrease.
We've gathered analysts' opinions on TANLA PLATFORMS LTD future price: according to them, TANLA price has a max estimate of 700.00 INR and a min estimate of 534.00 INR. Watch TANLA chart and read a more detailed TANLA PLATFORMS LTD stock forecast: see what analysts think of TANLA PLATFORMS LTD and suggest that you do with its stocks.
TANLA reached its all-time high on Jan 17, 2022 with the price of 2,096.75 INR, and its all-time low was 2.40 INR and was reached on Aug 7, 2013. View more price dynamics on TANLA chart.
See other stocks reaching their highest and lowest prices.
See other stocks reaching their highest and lowest prices.
TANLA stock is 5.07% volatile and has beta coefficient of 1.58. Track TANLA PLATFORMS LTD stock price on the chart and check out the list of the most volatile stocks — is TANLA PLATFORMS LTD there?
Today TANLA PLATFORMS LTD has the market capitalization of 87.34 B, it has increased by 3.42% over the last week.
Yes, you can track TANLA PLATFORMS LTD financials in yearly and quarterly reports right on TradingView.
TANLA PLATFORMS LTD is going to release the next earnings report on Oct 16, 2025. Keep track of upcoming events with our Earnings Calendar.
TANLA net income for the last quarter is 1.18 B INR, while the quarter before that showed 1.17 B INR of net income which accounts for 0.91% change. Track more TANLA PLATFORMS LTD financial stats to get the full picture.
As of Jul 27, 2025, the company has 1.03 K employees. See our rating of the largest employees — is TANLA PLATFORMS LTD on this list?
EBITDA measures a company's operating performance, its growth signifies an improvement in the efficiency of a company. TANLA PLATFORMS LTD EBITDA is 6.66 B INR, and current EBITDA margin is 17.55%. See more stats in TANLA PLATFORMS LTD financial statements.
Like other stocks, TANLA shares are traded on stock exchanges, e.g. Nasdaq, Nyse, Euronext, and the easiest way to buy them is through an online stock broker. To do this, you need to open an account and follow a broker's procedures, then start trading. You can trade TANLA PLATFORMS LTD stock right from TradingView charts — choose your broker and connect to your account.
Investing in stocks requires a comprehensive research: you should carefully study all the available data, e.g. company's financials, related news, and its technical analysis. So TANLA PLATFORMS LTD technincal analysis shows the neutral today, and its 1 week rating is buy. Since market conditions are prone to changes, it's worth looking a bit further into the future — according to the 1 month rating TANLA PLATFORMS LTD stock shows the neutral signal. See more of TANLA PLATFORMS LTD technicals for a more comprehensive analysis.
If you're still not sure, try looking for inspiration in our curated watchlists.
If you're still not sure, try looking for inspiration in our curated watchlists.