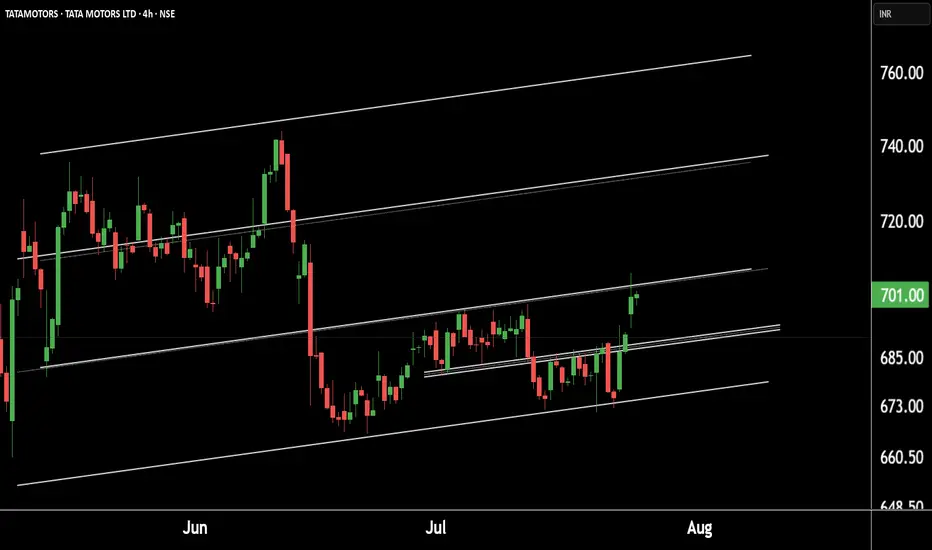
Tata Motors Gearing Up for a Fresh Rally! Technical Breakout !!This is the 4 hour chart of tata motor.
Tatamotor is moving in well defined parallel channel and bounced from it's supportt level near at 680, now ready for the breakout level at 705 .
If this level is sustain after the breakout then , we will see higher price in Tata motor.
Thank you !!
TATAMOTORS trade ideas
Tata Motors: From Profit Pressure to Growth Potential... Company Overview
* Name: Tata Motors Ltd.
* Industry: Automotive
* Key Segments: Passenger Vehicles (PV), Commercial Vehicles (CV), Electric Vehicles (EV), Jaguar Land Rover (JLR)
* FY25 Milestone: The Automotive business became debt-free
Q4 FY25 Performance Overview
* Net Profit: ₹8,556 crore (Down 51% YoY)
* Reason for Decline:
* High base due to deferred tax benefit in Q4 FY24
* Lower domestic volumes in PV and CV segments
* Reduced operating leverage amid falling demand
* Revenue: Marginal YoY increase (Consolidated revenue at record level for FY25)
* Positive Developments Despite Profit Decline :
* JLR Profitability Improvement
* Profit rose despite slightly lower revenue
* Supported by higher volumes and reduced depreciation
* Debt-Free Automotive Division:
* Major financial milestone for FY25 :
* Record Annual Revenue:
* Highest consolidated revenue in Tata Motors' history
* Future-Focused Investments:
* Capital allocation towards EVs, new product development, and manufacturing capacity
Strategic Growth Drivers – Reasons for Optimism
1. Electric Vehicle (EV) Leadership
* Tata Motors holds a dominant position in India’s EV market
* Plans to launch 10 EV models by 2026
* Battery Gigafactory is expected to begin production in 2026
* Strong alignment with India’s clean mobility goals
2. Expanding Product Portfolio
* Focused on SUV and ₹10–20 lakh price segments
* Upcoming launches:
* Curvv EV
* Harrier EV
* Sierra EV
* Strategy to cater to diverse customer preferences
3. Improving Financial Health
* Targeting 10% EBITDA across PV and EV divisions
* Demerger of CV and PV businesses to streamline operations and unlock value
4. Strong Base in Commercial Vehicles
* Market leader with 37.83% share in EV segment
* CV recovery is expected with infrastructure and rural demand growth
5. Supportive Macroeconomic and Policy Environment
* Government incentives: FAME II, PLI scheme
* EV-friendly policies encouraging domestic manufacturing
* Economic tailwinds: rising disposable income, urbanization, rural penetration
Risks and Challenges Ahead
* Intensifying Competition:
* Pressure from Maruti Suzuki, Hyundai, and new players
* Global Geopolitical and Trade Risks:
* US tariffs, material shortages (e.g., rare earths for EVs)
* Domestic Demand Slowdown:
* Inflation and high interest rates are affecting affordability
* Jaguar Land Rover’s Transition Challenges:
* EV transformation complexity
* Global demand volatility
* Production ramp-up hurdles
Conclusion
Tata Motors is at a pivotal juncture. While short-term profitability has taken a hit due to exceptional prior-year gains and cyclical volume pressures, the company’s fundamentals remain strong. Its leadership in EVs, ambitious expansion plans, and a now debt-free automotive business position it for long-term success.
However, realizing this potential depends on:
* Execution of its EV roadmap
* Sustained domestic demand
* Managing global uncertainties
* Staying competitive in an evolving auto landscape
Strategic Verdict:
Short-term caution, long-term confidence.
Tata Motors appears well-poised for a resilient comeback, driven by structural transformation and market-aligned growth strategies.
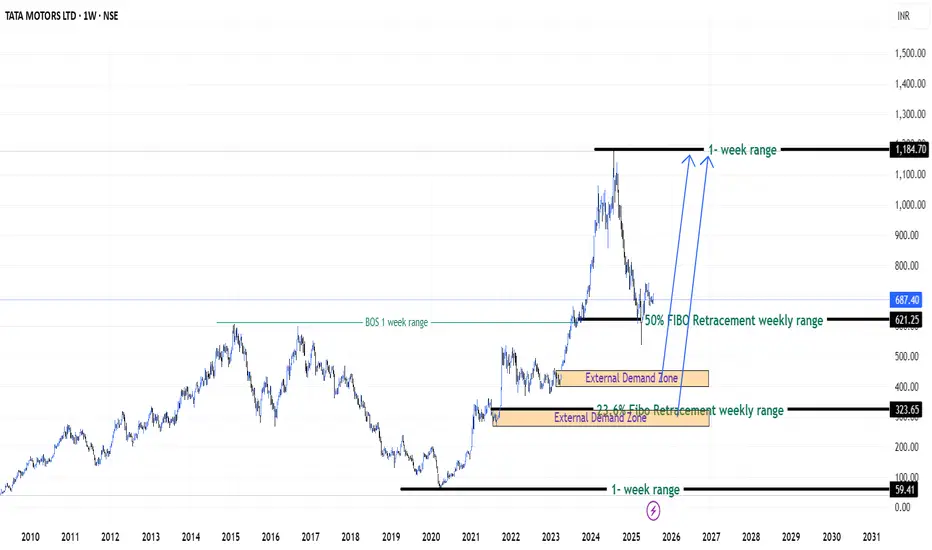
Patience on Tata Motors Stock (India) - {27/07/2025}Educational Analysis says that Tata Motors (Indian Stock) may give trend Trading opportunities from this range, according to my technical analysis.
Broker - NA
So, my analysis is based on a top-down approach from weekly to trend range to internal trend range.
So my analysis comprises of two structures: 1) Break of structure on weekly range and 2) Trading Range to fill the remaining fair value gap
Let's see what this Stock brings to the table for us in the future.
DISCLAIMER:-
This is not an entry signal. THIS IS FOR EDUCATIONAL PURPOSES ONLY.
I HAVE NO CONCERNS WITH YOUR PROFITS OR LOSS,
Happy Trading,
Stocks & Commodities TradeAnalysis.
My Analysis is:-
Short term trend may be go to the external demand zone.
Long term trend breaks the new high after going from discount zone.
Will rate cut by rbi play out in auto sector???Recently RBI cuts rates by 50 basis points on 6th june
this will help auto sector in volume pickup by sales& and revenue
according to reports rbi will cut rate by 25 basis points if this happens
then surely its a good bet for auto sector. we can add autos in our portfolio
for next Q-2 and Q-3......
As of now inflation is in control and according to CPI inflation data inflation is around at
2% which is at four years low and if this is the case then surely rbi cut down rate for
an economy boost so called Dovish move
Thanks and Regards
Devansh sharma
(M.D & CIO Green Bull)

[BUY] TATA MOTORS LTD WILL EARN 4 RUNSTata Motors Ltd 4hour candlestick chart shows
1. Clear Ascending Triangle Formation
2. Trendline connected everything.
3. There is no breakout yet on TL.
4. See chart for 1:1 ratio P/L.

Tata Motors with coup and HandleTata Motors from last few days is in red signal. There is formation of Coup with handle formation in 15 mins candle chart. so if it breaks it above we can see a big rally upto 698.

TATA MOTOR - LONGNSE:TATAMOTORS Weekly rounding bottom at location with accumulation formation of inv head and shoulder.

View Point on Tata Motors" Important Note: The views expressed here are solely my personal opinions and should not be considered financial advice or a trading recommendation. It's crucial that you do your own thorough research and consult with a certified financial advisor before making any investment choices. I hold no responsibility for your financial decisions or their results."

TATAMOTORSi Observed these Levels based on Price Action and Demand & Supply which is my own Concept "PENDAM CONCEPTS"... Please don't take any trades based on this chart/post... Because this chart is for educational purpose only not for Buy or Sell Recommendation... Thank Q

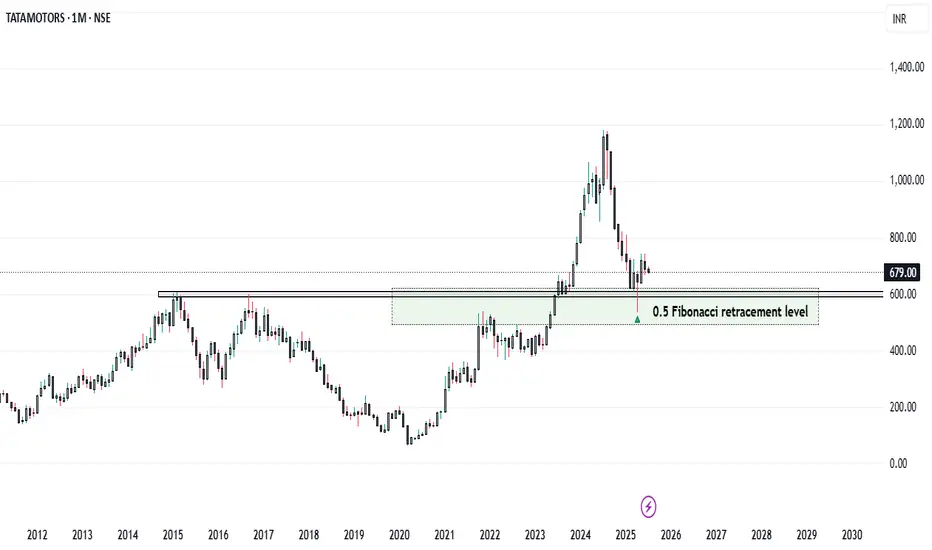
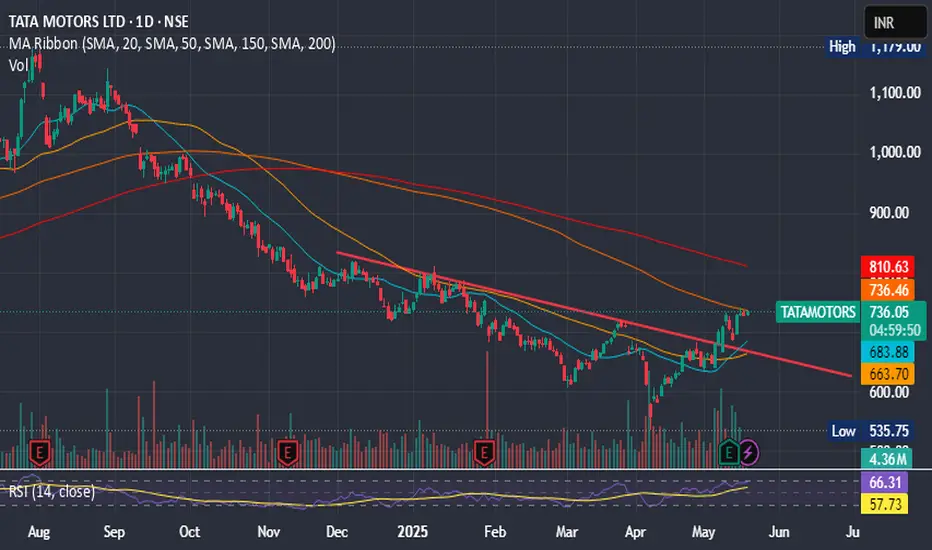
TATA- ko"bye-bye"bolna mana hain!!The structure suggests a completed Wave 4 correction at 0.5–0.618 Fibonacci retracement, setting up for the final Wave 5 leg. A bullish reversal is underway, supported by improving RSI and rising volume.
Key Levels:
Support: ₹603, ₹500, ₹465
Resistance: ₹725 (Fib), then new highs
RSI at 42.6 shows early bullish momentum. A weekly close above ₹725 could confirm Wave 5 ignition toward potential new highs.
Bias: Bullish | Wave 5 in Progress

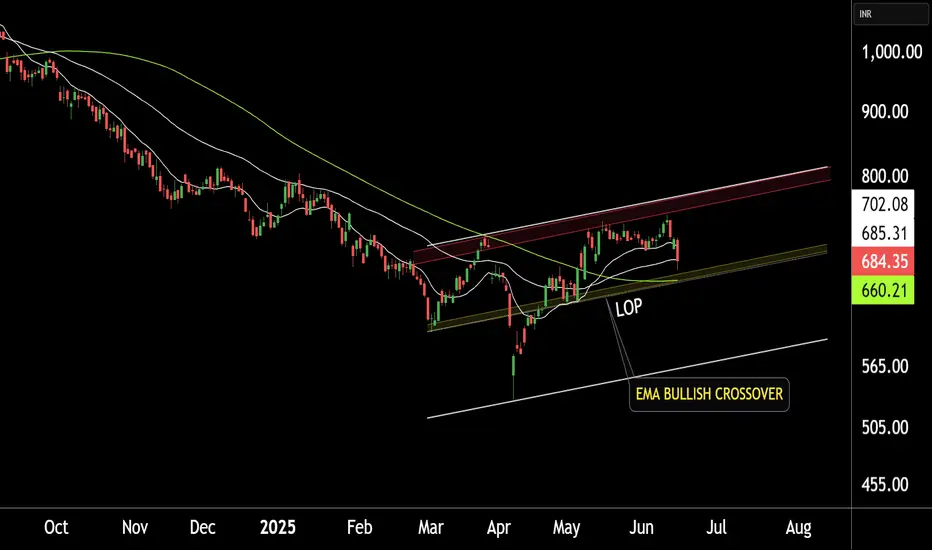
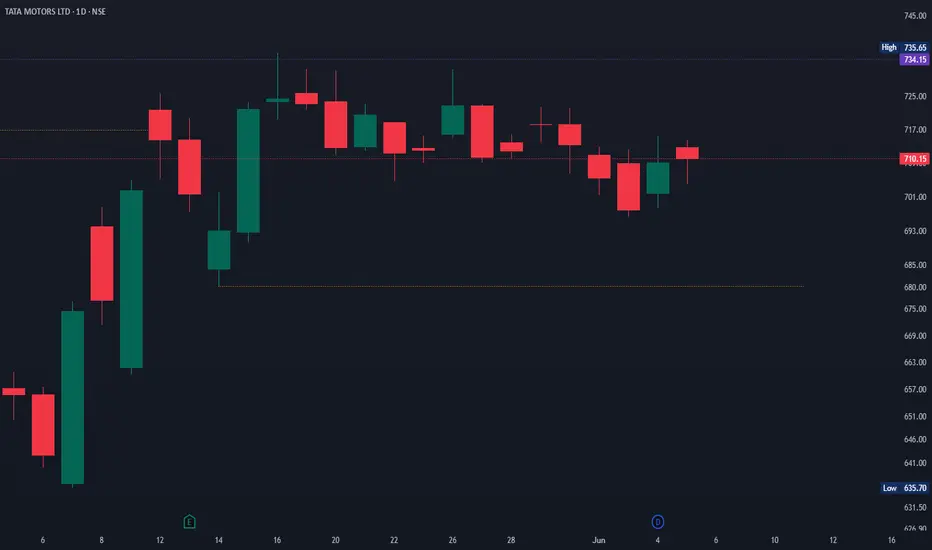
TATA MOTORS LTD at BEST SUPPORT !!This is the Daily chart of TATA MOTORS LTD.
TATA MOTORS having good law of polarity at 660 range.
TATAMOTORS has given a positive EMA crossover, with its support range lying around 660-680.
If this level is sustain , then We may see higher price in TATAMOTORS.
Thank you !!
Buy the Dip: Tata Motors Set to Zoom from ₹713 to ₹799!Consider buying Tata Motors stock below ₹713 with a long-term target of ₹799, offering a potential profit of approximately 12%.

TATAMOTORS | Buy above 755 | SL below 700 | 1st Target 940Disclaimer:
This is not financial advice. Please do your own research or consult with a financial advisor before making any investment decisions. Investments in stocks can be risky and may result in loss of capital.

TATA Motors going toward 2000multi bagger TATA stock is TATA Motors
technical indicator and fib extension shows the target of 2000 in 2025...

TATA MOTORS🎯 Trade Setup Overview
Parameter Value
Trade Type BUY
Entry ₹708
Stop Loss (SL) ₹686
Risk ₹22
Target ₹1308
Reward ₹600
Risk-Reward Ratio (RR) 27.3 (Exceptionally high)
Last High ₹1180
Last Low ₹580
TATA MOTOR DAILY CLOSING ABOVE 75O IS FULL CONFIRMATION UPTREND
✅ Key Strengths of the Setup
Full Timeframe Alignment: Every timeframe is in an UP trend, indicating broad bullish participation.
Strong Demand Confluence: Entry point lies directly on top of the tightest MTF + ITF demand zone (708–686).
Ultra High R:R: 27.3 RR is excellent. Even if you partially book near the last high (₹1180), RR remains >20.
Structure Confirmation: ₹580 as last low implies a wide gap from SL, further confirming upward structure.
⚠️ Risk Considerations
Entry is High in Zone: At ₹708, you are buying at the top of the zone. Wait for confirmation (bullish candle / volume) before triggering entry.
SL is Close to Distal: SL at ₹686 is just within demand; any wicking below ₹686 might trigger premature exit if you don't use a buffer or alerts.
Volatility Watch: Given such a massive upside target, ensure volatility or news-based spikes don’t lead to drawdowns before breakout.
📌 Strategy Tips
📈 Breakout Entry Confirmation: Consider entering after price closes above ₹710–₹712 on a strong daily candle.
🔁 Scale-In Strategy: You may enter part of the position at 708, add near 690 if price retests the base.
🎯 Staggered Targets: Book partial profits at:
₹1180 (previous high)
₹1250 (psychological level)
₹1308 (final target)
🔍 Multi-Timeframe Trend & Demand Zone Breakdown
🔸 High Timeframe (HTF)
TF Trend Zone Logic Proximal Distal Avg
Yearly UP Demand SWAP 537 381 459
Half-Yearly UP Demand BUFL 599 585 592
Quarterly UP Demand BUFL 665 585 625
HTF Average - - - 600 517 559
Note: Strong long-term demand structure. Price is well above HTF zones, showing continuation of an established uptrend.
🔸 Mid Timeframe (MTF)
TF Trend Zone Logic Proximal Distal Avg
Monthly UP Demand BUFL 678 602 640
Weekly UP Demand SOE 686 665 676
Daily UP Demand DMIP 708 686 697
MTF Average - - - 691 691 691
Observation: All zones tightly clustered between 678–708. The entry at 708 is at the top of demand, ideal only if price reacts bullishly from here.
🔸 Intraday Timeframe (ITF)
TF Trend Zone Logic Proximal Distal Avg
240M UP Demand BUFL 708 686 697
180M UP Demand BUFL 708 686 697
60M UP Demand BUFL 708 686 697
ITF Average - - - 691 691 691
Observation: ITF zones mirror the Daily zone. Proximal zone = entry. If price holds this level, there’s strong potential for a breakout.

TataMotors Time To BoostTataMotors Recently Touched Day 1 Timeframe Demand Zone And In Previous He Also Touched Monthly / Quarterly Demand Zone So Trend Is UP Perfect Swing Trading Setup

Tata Motors at Key Turning Point! Massive Upside Potential After🚗 Tata Motors – Breakout Setup from Monthly POI | Long-Term Opportunity Ahead!
🧭 Technical Context & Setup:
Tata Motors is shaping up as a high-probability breakout candidate after a ~55% correction from its all-time high of ₹1,168 to a recent low of ₹531.
✅ Monthly POI tapped: Strong bounce seen
✅ Liquidity Swept: Price swept the recent low zone and formed a hammer candle, a bullish reversal signal
✅ Change in State of Delivery (CISD) visible on weekly timeframe, showing fresh buying interest
📉 Price Structure Observations:
Last 4 weeks (20 trading sessions) = clear sideways consolidation
This kind of compression often precedes a strong directional move
📍 Key Reference Levels:
All-Time High (ATH): ₹1,168
Recent Low: ₹531
Consolidation Range: ₹695 – ₹736
🚦 Trade Entry Plans:
✅ Entry Type 1: Breakout Entry
🔓 Entry Trigger: Breakout and close above ₹736 on 1H or Daily candle
🎯 Short-Term Targets:
Target 1: ₹803
Target 2: ₹950
📌 Expect possible pause/consolidation near ₹950 zone
✅ Entry Type 2: Sweep & Reversal Entry
🔄 Wait for price to sweep below ₹680 and show a reversal candle (engulfing, hammer, or bullish structure on 1H/4H)
Enter near ₹680–₹670 zone upon confirmation
🎯 Targets remain the same (₹803 / ₹950) with much better risk-reward
🛡️ Stop Loss Strategy:
🔻 Conservative SL: ₹620 (Recent lower time structural low)
🛠️ OR use trailing stop-loss as price moves upward — especially for long-term investors
🔮 Long-Term View:
Once this base breaks out, the next structural targets open up to previous swing highs.
🏁 Potential Long-Term Target: ₹1,168 (All-Time High retest)
💡 Price could consolidate near ₹950 before continuing its journey — patience is key for positional traders
🔎 Why This Trade Matters:
✅ Monthly POI reaction + liquidity grab
✅ Strong reversal signal (hammer)
✅ Tight consolidation = energy build-up
✅ Clear breakout structure = easy trade management
🧠 Quote to Remember:
“When price rests, it gains energy. When it moves, it releases that energy. Catch the move, not the noise.”
📢 Don’t Miss Out!
✅ Follow for more high-probability technical setups
👍 Like if you found this helpful
💬 Comment below your thoughts, let’s discuss this move together!
📊 See you in the next breakout 🚀
TATAMOTORS is in confusion to go up or downTATA MOTORS Is in confusion to go up or down, just follow its move encash your trade, lets see what happens

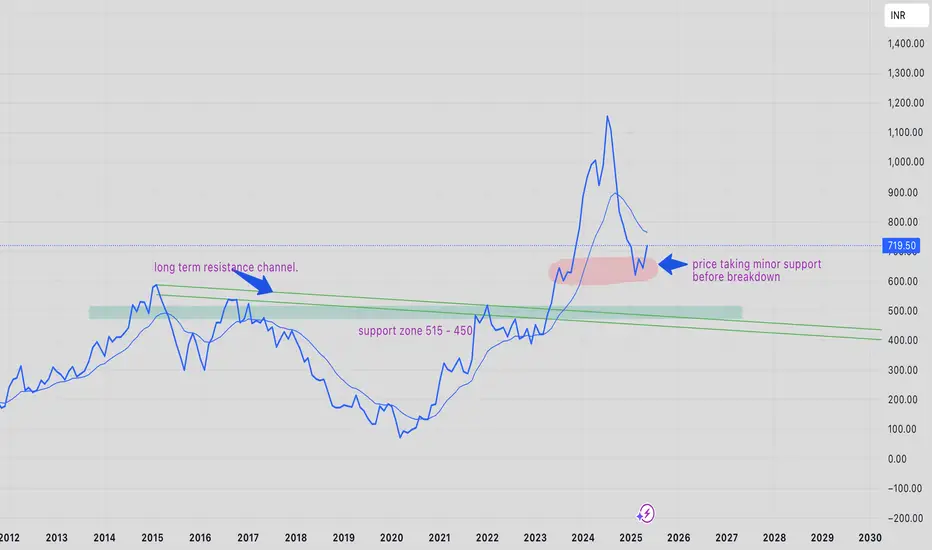
price analysis of TATAMOTORS-EQ for long term goalsTATAMOTORS-EQ price trend is in downtrend this is because price is trying to retest its previous all time high resistance zone ~550 - 425.
people of wish to add and have a long term goal it is better to add at those lvls because the current bounce might be used as selling opportunity by traders/speculators because of minor support.
as always people are advised to trade as per their risk capacity.
TATA MOTORS🟢 Trade Plan – BUY: TATA MOTORS
Parameter Value
Entry-1 ₹708
Stop Loss (SL) ₹680
Risk ₹28
Target Price ₹1193
Reward (Target) ₹485
Risk-Reward (RR) 17.3
Last High ₹1200
Last Low ₹715
Note Once price moves above ₹750 after pullback, treat as uptrend confirmation
🔑 Trade Insights
Risk is well-contained at ₹28 with a substantial upside potential of ₹485.
RR of 17.3 is excellent, indicating a highly favorable reward-to-risk ratio.
Keep an eye on the ₹750 breakout after pullback as your momentum confirmation point.
The last high near ₹1200 aligns well with your target, adding credibility.
Multi-Timeframe Demand & Trend Analysis (TATA MOTORS)
Timeframe Trend Logic / Pattern Proximal Distal Average
Yearly UP Support & Resistance 606 536 571
Half-Yearly UP BUFL 599 584 592
Quarterly UP BUFL 665 584 625
HTF Avg UP 623 568 596
Monthly UP Rally Base Rally 665 584 625
Weekly UP DMIP 682 635 659
Daily UP DMIP 708 686 697
MTF Avg UP 685 635 660
240M UP DMIP 708 686 697
180M UP DMIP 708 686 697
60M UP DMIP 708 686 697
ITF Avg UP 708 686 697
Trade Points Average: Proximal = 672, Distal = 630, Average = 651

TATA MOTORS IGNITING MOMENTUM - Pivot Points: The classic pivot point is 731.45, with resistance levels at 733.4, 736.3, and 738.25, and support levels at 728.55, 726.6, and 723.7
Tata Motors' short-term trend appears bullish, with analysts predicting an upside target of ₹770–780 in the coming weeks. The stock has shown strong resilience near its support level of ₹715 and is trading above key short-term moving averages, signaling strength.
Key Levels:
- Support: 715–720
- Resistance: 735–740
- Target: 770–780 OR MORE TOWARDS 823
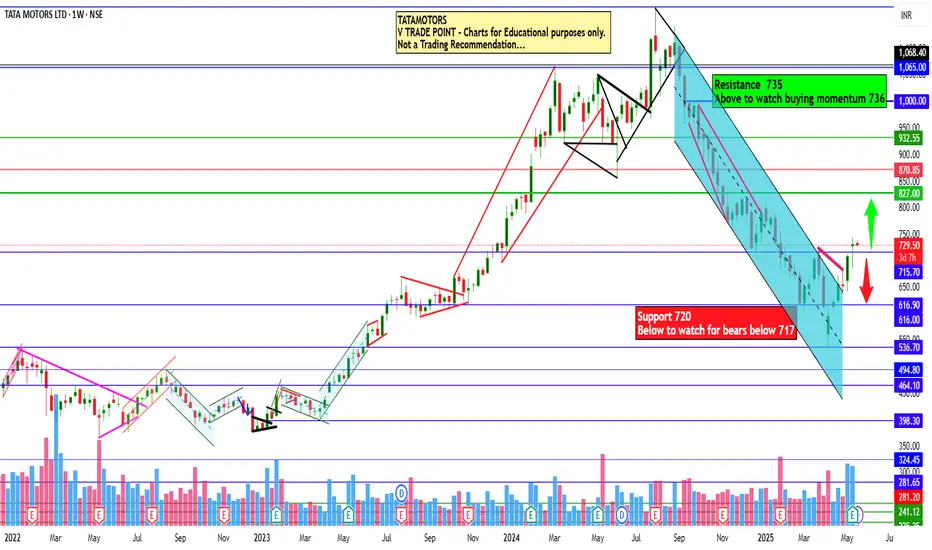
TATA Motors Ltd view for Intraday 20th May #TATAMOTORS TATA Motors Ltd view for Intraday 20th May #TATAMOTORS
Resistance 735 Watching above 736 for upside momentum.
Support area 720 Below 725 ignoring upside momentum for intraday
Watching below 717 for downside movement...
Above 725 ignoring downside move for intraday
Charts for Educational purposes only.
Please follow strict stop loss and risk reward if you follow the level.
Thanks,
V Trade Point
Tata Motor Inverse Head and Shoulder Bullish Reversal Tata Motor Inverse Head and Shoulder Bullish Reversal
