Tatamotors go for longCup and handle breakout happend
Flag breakout happend
buy above 634 with overall target of 1000
TATAMOTORS trade ideas

TATAMOTORS SWING Tata motors reverse from its support looking for 634 and 643 in near days make position with a cell 610

TATA MOTORS LTDStock always support in trendline.
But now stock broke the line
20 Dema react as a support but also 20 Dema breakdown.
Macd gave bearish signal.
Stock is very week.
Disclaimer this is my personal view for education purpose only

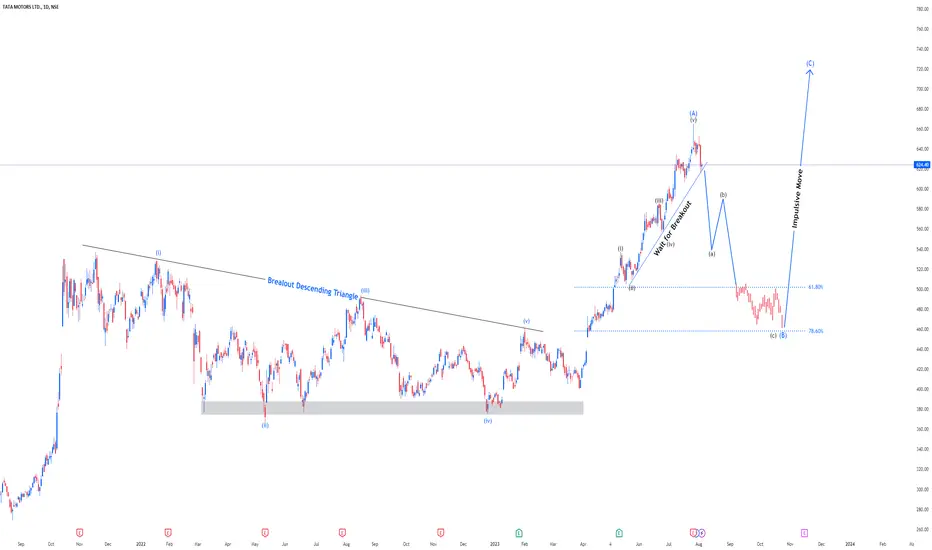
Pin point predictions Of Tata Motors For 7 to 11 August 23Hi Traders,
This chart of tata motors shows my trading plan for next week. . If you want to get complete entry and exit then check below.

TATAMOTORSlooking short term bearish trend after breakout trendline then start long term bullish term after 61% retracement compalte in 4h timeframe
TATA MOTORS SELL Welcome. As per my analysis of Tata Motors stock. There is a high probability of a bearish move with a very negative candle in the last channel of the Pitchfork orbit. With a very large red confirmation candle on the daily chart, it indicates a strong entry of sellers into the stock. Good luck everyone

tata motors bearish divergence triggeredbetter not to invest in tata mototrs right now ..
can reach 530 .if slipped below 530 can reach 430 as beasish view

"Tatamotors"Tatamotors on channel suppport on daily chart,
cmp 631
SL 627
best time to make position fo recent target 680
#stocktrading, #StocksToBuy

Pin Points predictions of Tata Motors For 1 to 5 Aug 2023Hello Traders,
This chart shows the real path that price has to follow , you just need to check below the complete way of using in your trading . Hope that explanation would help you more .

TATA MOTORS bullish pattern target 1000tata motors long term bullish setup .can reach 1000 in 3-4 months.best investment setup.

Huge BREAKOUT is on the way in TATA MOTORSAbout Company:-
Tata Motors Group is a leading global automobile manufacturer. Part of the illustrious multi-national conglomerate, the Tata group, it offers a wide and diverse portfolio of cars, sports utility vehicles, trucks, buses and defence vehicles to the world.
Technical and fundamental analysis:-
Tata Motors is consolidating in bullish flag pattern from many days,,Now breakout is possible in it,,Above 465 we can see one sided momentum in tata motors..In recent days good volumes we have seen in it..people accumulating in deliveries from some days..this overall showing a positive moment in this ticker,,many analytics says TATA MOTORS in indian Tesla stock.
Market Cap
₹ 159,502 Cr.
Current Price
₹ 446
High / Low
₹ 512 / 366
Stock P/E
Book Value
₹ 78.8
Dividend Yield
0.00 %
ROCE
1.40 %
ROE
-22.3 %
Face Value
₹ 2.00
Debt
₹ 144,354 Cr.
EPS
₹ -12.1
PEG Ratio
Promoter holding
46.4 %
Intrinsic Value
₹
Pledged percentage
1.82 %
EVEBITDA
8.72
Overall company is good and trading at good price and range is bullish...Accumulate for long term as well as short term,,,everyone knows that this ticker belongs to our country most trusted TATA GROUP.
This analysis was requested by one of my follower @carefulMoth40462
I hope this will work for you and others too.
Please guy's if you like my work hit like and follow button.
Thankyou:)

TATAMTRDVRTatamtrdvr Chart Analysis.......26/07/23
Tatamtrdvr Long - 375,
Sl - 325
Target - 412 / 565
Enjoy !

TATA MOTORSTata Motors Group is a leading global automobile manufacturer. Part of the illustrious multi-national conglomerate, the Tata group, it offers a wide and diverse portfolio of cars, sports utility vehicles, trucks, buses and defence vehicles to the world.
TARGET AND STOP LOSS REFER CHART - LONG TERM
Market Cap
₹ 158,232 Cr.
Current Price
₹ 442
Book Value
₹ 78.8
Dividend Yield
0.00 %
ROCE
1.40 %
ROE
-22.3 %
Face Value
₹ 2.00
Promoter holding
46.4 %
EPS last year
₹ -34.5
EPS latest quarter
₹ 8.91
Debt
₹ 144,354 Cr.
Pledged percentage
1.82 %
Net CF
₹ 6,459 Cr.
Price to Cash Flow
10.3
Free Cash Flow
₹ -655 Cr.
Debt to equity
5.52
OPM last year
8.88 %
OPM 5Year
9.48 %
Reserves
₹ 25,409 Cr.
Price to book value
5.60
Int Coverage
0.68

#TATAMOTORS - ATH BO, Retest & Continuation#TATAMOTORS - ATH BO, Retest & Continuation
Buy above 635

Pin Point Predictions Of TaTa Motors For 24 to 28 July 23Hi Traders,
The predictions on this stock going to use for next week if conditions mentioned in explanation are met. For this check below.

Tata Motors breaking resistance Keep tracking Tata Motors, buy it on 621. It breaking decline resistance will soon reach at 630.

Pin point entry of Tata Motors For 17 to 23 June 23Hi Traders,
This chart of Tata motors shows the complete plan of Entry next week. If you want to know the exact trade plan then check below.

635 above buying opportunity in tata motorsTATAMOTORS view for intraday 12th July
635 above
Follow strict risk reward and stop loss..
Charts for Educational purposes only.
Thanks,
V Trade Point

Short Tata MotorsTata Motors looking for trend reversal, I am expecting 500 and 440 from current levels, SL 591-605
If Monday it opens 2% +ve, I will definitely short this one

Tata is accelerating upward trendTata is accelerating upward trend
This chart shows the weekly candle chart of tata stocks for the past 4 years. The graph overlays the bottom to top golden section at the beginning of 2020. As shown in the figure, the 2021 high point of the tata stock was precisely suppressed by the 1.618 position of the golden section in the figure, and then moved out of the contraction triangle consolidation! After reaching the end of the triangle consolidation in March this year, the tata stock rose sharply and is about to hit the strong pressure of the 2.000 level in the golden section of the chart!

TATAMOTORS Breaks Resistance, Targets 700+TATAMOTORS has recently surpassed a significant monthly resistance, reaching a new all-time high. The formation of a strong bullish trend suggests that the rally might continue, potentially pushing the stock above the 700 level. This assumes that buyer sentiment remains robust.

TATA MOTORS LONGA multi year breakout is clearly visible on daily & weekly chart. one can long from the current level .

Tata motors: brakes out?8 years high breakout, ATH reached, it may move fast and furious, 1st Target 800.
