TatamotorsIt is in the support line and the target is the resistance trend line. The rsi is near 30.So it is a good opportunity to go long and make handsome profit.
TATAMOTORS trade ideas

TATAMOTORS LONG INTRADAY 14 JUL,2021Dear trader,
If u look at the chart of TATAMOTORS (analysis based intraday only) the TATAMOTORS Buy at 309 and Target at 317
Best Buy at 306.
Our Best Buy is based on high quality research and when the instrument reaches this level , it’s a jackpot trade.
Best Buy level might be executed or might not be executed.
The chart clearly indicates Bullish Trend you can also see the candle stick patters for more indepth analysis.
In Intraday most important thing is to enter and exit points.
Our signals are based on analytics, algorithms, mathematical derivatives.
Always be a responsible trader, kindly trade only when you have maximum opportunity in the market with minimum risk and with keynotes like data, analysis and proper strategies.
Kindly message us for strategies and analysis.

Possible trade in Tata Motors DVR# With recent fall in Tata motors shares due to guidance on weak volumes in Q2, the stock is down sharply.
# It seems to be taking support at 100 Day Simple moving average.
# If there is a closing above 146.75 on a day, one can go long with a SL at 139.9 and a target of 160 for a risk reward of 1:2

TATA MOTOR - Good Swing CallSell Below 302 - T1: 280, T2:267, T3:242, T4-202
Buy Above 314- T1:341, T2:397, T3-480
Any 30 MIN candle should be close above/below the levels 302 or 314.
This is swing call, can hold for 2-3 months for good returns guranteed.

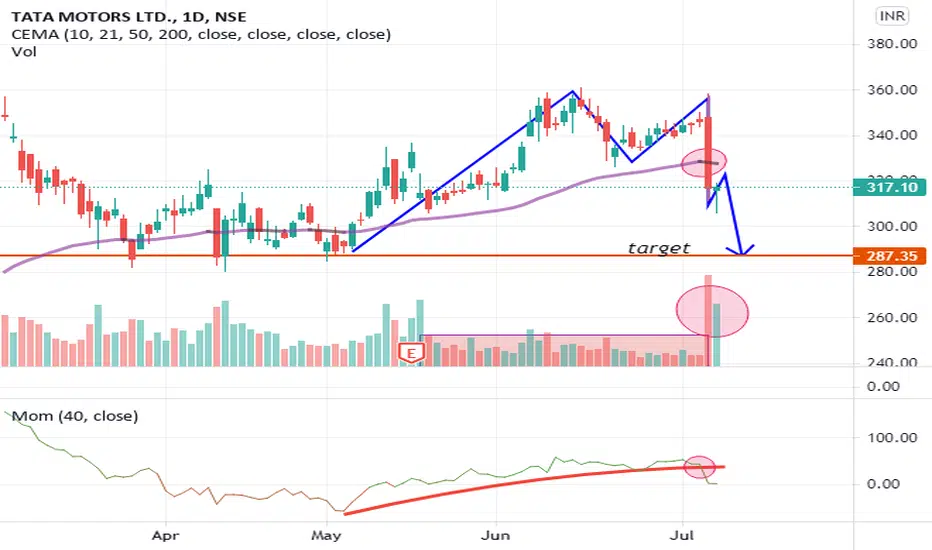
What to expect from TATAMOTORS.NSE:TATAMOTORS
After Sluggish/consolidated move from 8th Feb 2021 and few test to the resistance level of 351 we did see good down move with good efforts in last week from same level, one can say due to the negative news of JLR results. Which was not expected at least by me.
So what to expect from here in TATAMOTORS, well not matter what kind of news cause this effect on TATAMOTORS chart but as far as CANDLE formation and kind of efforts it got its clearly indicating supply in here. If we see follow through selling and breakdown to the level of 280 swing and short term traders must get out of this counter. In closing below 280 will take TATAMOTORS deeper towards the level of 200. And if we don’t see any follow through selling and rather we see bounced back from here we must have to wait for breakout to the level of 351 to make any fresh positions in this counter.
Bounce back can also be expected coz on daily chart we are not seeing good follow through selling as price range is narrowed and volume is also drying out. Check the chart below.
Conclusion one can wait and watch only those who have holding any position right now don’t though them out till closing below 280. And swing and short term traders who are looking for fresh positions in this counter prefer to wait for a breakout of 351.
Long term investors don’t need to worry here. Any stopping or sign of reversal can be good opportunity for averaging.
|| Hari Om ||
|| Ambadnya ||

POSITIONAL INVESTMENT VIEW IN #TATAMOTORSPOSITIONAL INVESTMENT VIEW IN #TATAMOTORS GIVEN CORRECTION FROM 0.5 DOWN TO UPSIDE FIB LEVELS
BUY TATAMOTORS CMP @ 308
ADD MORE ON DEEP 270.70 & 244.45
STOP LOSS - 236 CLBS
TARGET - 398 489 605 800 100 1200 ++
INVESTMENT IN MULTIBAGGER STOCK #TATAMOTORS


Tata Motors-Re-Entry LevelsTata Motors Stop Loss Hit. I am looking for a Re-Entry on 285 levels or 200 EMA(Blue Line).EMA is raising. Its in a Range. Its still Bullish.

TATAMOTOR VIEWTATAMOTOR DAILY VIEW.. DAILY LOOK OVERALL DOWN TREND SLOWLY SEEN DOWN SIDE CORECTION 220 180 LEVEL...


Tata motors analysis on daily timeframe Tata motors could fall till 280. it's a major support zone, investors might look to buy again at that price.

Call 100% long buyBuy 317
If come at 310 100% take this tomorrow
Take call option 100 % target simple
Take some profit and exit

VIEWThis is a bit risky trade as news is there. 311.50 is the level, below it stock will be bearish for the day. TATA MOTOR 310 PE @13.80 could be a good buy. Keep a target of 307-306 in spot. Or short future.

TATA MOTOR FOR BEST LEVEL BUY @280 282Tata motor best level buy 306 support price 326 rejection then go low 280 level


Buy TATAMOTORSA Bullish Golden Cross is seen on Weekly charts of TATAMOTORS.
Potential upside is possible to 444 levels and then 539-581 levels. Stoploss can be kept below the pennant or @319 (conservative)
The upmove can be fast as price has broken out of a pennant pattern on the weekly charts.
Also price has broken upward from a long term price zone (indicated by red rectangle)
Risk Reward is 4:1

Tata Motors is Ready To Show Whose The Boss To Tin Cans. BUY BUYTata Motors as you guys can see is looking yummy and is ready for the target of 430 in the short term.
And Long Term you know that debt reduction and all that shit will take it to the moon!


TATAMOTORS LONG INTRADAY 2 JUL,2021Dear trader,
If u look at the chart of TATAMOTORS (analysis based intraday only) the TATAMOTORS Buy at 344 and
Target at 351
Best Buy at 339
Our Best Buy is based on high quality research and when the instrument reaches this level , it’s a jackpot trade.
Best Buy level might be executed or might not be executed.
The chart clearly indicates Bullish Trend you can also see the candle stick patters for more indepth analysis.
In Intraday most important thing is to enter and exit points.
Our signals are based on analytics, algorithms, mathematical derivatives.
Always be a responsible trader, kindly trade only when you have maximum opportunity in the market with minimum risk and with keynotes like data, analysis and proper strategies.
Kindly message us for strategies and analysis.
