Tata Motors (Daily Timeframe) AnalysisChart Pattern & Trend:
Primary Trend: The stock previously followed a rising channel pattern, peaking near ₹1,176.50. After breaking the channel's lower boundary, it entered a significant downtrend.
Current Trend: Bearish, as the stock has consistently been making lower highs and lower lows.
Fibonacci Levels:
The Fibonacci retracement tool highlights key levels:
61.8% Level (₹880.35): This level acted as a minor support before breaking down.
50% Level (₹788.85): The stock is hovering around this level, attempting to stabilize.
38.2% Level (₹697.40): If the downtrend continues, this could be the next key support.
23.6% Level (₹584.20): A deeper correction might test this level in a prolonged bearish scenario.
Volume Analysis:
Declining volumes suggest weakening momentum on the downside.
A volume spike at key support levels could indicate buying interest.
RSI (Relative Strength Index):
RSI is in the oversold zone or nearing it, indicating potential for a short-term pullback or consolidation.
Key Levels to Watch:
Resistance: ₹880 (61.8% Fibonacci) and ₹900 are immediate resistance zones.
Support: ₹788 (current level) and ₹697 (38.2% Fibonacci) are critical supports.
Potential Scenarios:
Bullish Reversal: A breakout above ₹880 with increasing volumes could signal the beginning of a recovery.
Continued Bearishness: A breakdown below ₹788 could lead the stock toward ₹697 and ₹584.
Trading Strategy:
For Long Positions: Look for reversal patterns around ₹788 or ₹697, supported by RSI divergence and volume confirmation.
For Short Positions: Consider selling near resistance levels like ₹880 with a stop-loss above ₹900.
TATAMOTORS trade ideas

Go Woke Go Broke TATA Motors. TATA Motors.
Are we going to be selling a huge push to the downside of TATA Motors, who The company produces cars, trucks, vans, and buses.
Subsidiaries include British Jaguar Land Rover and South Korean Tata Daewoo.
Due to Jaguars recent advertisement that has caused out rage on the Social media platforms. Do we see high stake investors leaving?
Fib is showing to us it can go all the way back down to $314 per share. This would be a massive 60% sell off.
Now of course TATA motors don't just do Jaguars but other motors as well.

TATA MOTORS BEST FOR BUY AND HOLD TIGHTLY TRGT : 1500Tata Motors Group is a leading global automobile manufacturer. Part of the illustrious multi-national conglomerate, the Tata group, it offers a wide and diverse portfolio of cars, sports utility vehicles, trucks, buses and defence vehicles to the world.
It has operations in India, the UK, South Korea, South Africa, China, Brazil, Austria and Slovakia through a strong global network of subsidiaries, associate companies and Joint Ventures (JVs), including Jaguar Land Rover in the UK and Tata Daewoo in South Korea

TataMotor AnalysisAnalyzed TATA Motors from its all time high and then considered 49 weeks time cycle. It gave me the conclusion that it is looking weak below 800(On daily closing basis).

Tata motor : Wave Analysis, Support & Anticipated Target areaThe chart provided illustrates Tata Motors' price movements and technical levels on a weekly timeframe, showcasing a detailed Elliott Wave count and Fibonacci retracement levels. Below is the analysis based on the chart:
---
Key Observations :
1. Elliott Wave Analysis:
The chart highlights a 5-wave structure of Elliott Wave theory:
Wave (1), Wave (2), Wave (3), Wave (4), and the anticipated completion of Wave (5).
Currently, the chart seems to be in Wave (4), showing a corrective phase after a significant upward trend in Wave (3).
The possible completion of Wave (4) is indicated near a support area at ₹730 , before the start of Wave (5), which could represent another bullish rally.
2. Fibonacci Levels:
Fibonacci retracement levels are drawn from the Top of Wave (3) to the Bottom of Wave (2).
Key retracement levels to monitor include:
0.382 (₹839.55): The price is near this level currently, indicating a crucial point of support.
0.5 (₹750.10) and 0.618 (₹660.65): These levels could act as deeper support zones if the price continues to correct.
A bounce from these levels could indicate the continuation of the bullish trend into Wave (5).
3. Support and Resistance Zones:
- Support:
- The ₹730 zone is labeled as a critical support level.
- Other potential support levels are marked by Fibonacci retracements (₹839, ₹750, ₹660).
- Resistance:
- The high of Wave (3) around ₹1,100 serves as a major resistance level.
- Further upside resistance lies beyond the ₹1,300 mark (based on Fibonacci extension levels of Wave (5)).
4. Volume Analysis:
There is a significant spike in volume during Wave (3), suggesting strong buying momentum during the rally.
The current corrective phase (Wave (4)) exhibits relatively lower volumes, which aligns with the consolidation nature of corrective waves.
5. Long-Term Projection:
If Wave (5) materializes, the target for the next bullish move could extend towards the Fibonacci extension levels of ₹1,300–₹1,500.
This aligns with a broader upward trend.
---
Conclusion and Recommendation:
- Bullish Bias: Tata Motors remains in a long-term uptrend, with Wave (5) likely to result in new highs if the corrective phase (Wave 4) holds above key support levels.
- Support Focus: Investors should watch the ₹730–₹750 range for signs of reversal or accumulation.
- Risk: A break below ₹660 could invalidate the bullish structure and signal a deeper correction.
- Strategy: Traders could consider entering long positions near the identified support zones with appropriate stop-loss levels, targeting higher Fibonacci extensions for Wave (5).
---

Short Sell Idea for #TataMotorsTata Motors has broken a crucial trendline support, currently trading around ₹805. Weak RSI suggests further downside potential. Watch for a potential drop towards the next support at ₹672 if bearish momentum continues.
📉 Entry: Below ₹800
📉 Target: ₹672
📉 Stop-Loss: Above ₹850

TATA Motor Bullish viewIt seems, TATA Motor would bounce back from this level to 1000 levels.
it could touch all time high if market supports.
This is shared only for the educational purpose.

Can we see possible trend reversal in Tata motors Tata motors has been in correction for a while now.
Daily chart looks like zigzag ABC correction wherein C is 1.6. Times of A .
1hrly chart can decisively make out 5 implusive waves on downside with MULTIPLE BULLISH DIV.
Additionally, lot of neural candles have come post the bearish breakdown candle.
Once good bullish candle taking the high of bearish candle can change the overall view to bullish biasness till next major. resistance.

swing pick - buy at zonenifty 50 is going for correction in , keep buy nifty 50 in dips.
BUY at zone - swing
ENTRY
- lines marked below is potential reversal zone ( PRZ)
- entry is strictly inside the zone
- look for buying confirmation in smaller time frame ( 15 minutes preferred )
EXIT
1. target
- mark fib retracement from C to latest swing low
- TGT 1 - 0.236 fib level ( intraday tgt)
- TGT 2 - 0.382 fib level
- TGT 3 - 0.5 fib level ( preferred target )
2. SL
- candle close below (PRZ)
- if u didn't get confirmation inside the zone , ignore this pick
- if candle close is below zone , this pattern becomes invalid . IGNORE THIS PICK
- RE-ENTRY can be done , if u again get buying confirmation inside the zone

TATA MOTORS S/R for 23/10/24Support and Resistance Levels:
Support Levels: These are price points (green line/shade) where a downward trend may be halted due to a concentration of buying interest. Imagine them as a safety net where buyers step in, preventing further decline.
Resistance Levels: Conversely, resistance levels (red line/shade) are where upward trends might stall due to increased selling interest. They act like a ceiling where sellers come in to push prices down.
Breakouts:
Bullish Breakout: When the price moves above resistance, it often indicates strong buying interest and the potential for a continued uptrend. Traders may view this as a signal to buy or hold.
Bearish Breakout: When the price falls below support, it can signal strong selling interest and the potential for a continued downtrend. Traders might see this as a cue to sell or avoid buying.
20 EMA (Exponential Moving Average):
Above 20 EMA(50 EMA): If the stock price is above the 20 EMA, it suggests a potential uptrend or bullish momentum.
Below 20 EMA: If the stock price is below the 20 EMA, it indicates a potential downtrend or bearish momentum.
Trendline: A trendline is a straight line drawn on a chart to represent the general direction of a data point set.
Uptrend Line: Drawn by connecting the lows in an upward trend. Indicates that the price is moving higher over time. Acts as a support level, where prices tend to bounce upward.
Downtrend Line: Drawn by connecting the highs in a downward trend. Indicates that the price is moving lower over time. It acts as a resistance level, where prices tend to drop.
RSI: RSI readings greater than the 70 level are overbought territory, and RSI readings lower than the 30 level are considered oversold territory.
Combining RSI with Support and Resistance:
Support Level: This is a price level where a stock tends to find buying interest, preventing it from falling further. If RSI is showing an oversold condition (below 30) and the price is near or at a strong support level, it could be a good buy signal.
Resistance Level: This is a price level where a stock tends to find selling interest, preventing it from rising further. If RSI is showing an overbought condition (above 70) and the price is near or at a strong resistance level, it could be a signal to sell or short the asset.
Disclaimer:
I am not a SEBI registered. The information provided here is for learning purposes only and should not be interpreted as financial advice. Consider the broader market context and consult with a qualified financial advisor before making investment decisions.

Tata MotorsStock resumed its bullish trend after the recent fall on 4-Jun-2024.
CMP as on 14-Jun-2024 is 993.4
support zone is seen at 945 - 954
stop-loss is 896
for short term ..target is 1049 & 1065
if 1065 is crossed then we can expect 1139 and 1257
Caution is required before investing .. kindly consult your financial adviser before taking decision
this analysis is for education purpose only

Stock Watch: Tata Motors is About to Skyrocket!Tata Motors is finally shaking off its sluggish spell and gearing up for an uptrend! 🚀 After a period of consolidation, the stock is showing promising signs of breaking out. 📈 Tata Motors looks ready to zoom ahead. Keep an eye on this one – it might just be the golden ticket! 🌟🚗
Note: View invalidates if there is a daily close below 900.
Disclaimer: All ideas are my personal views and not financial advise. I do not have any Telegram channel nor do I sell any courses.

TATAMOTORSNSE:TATAMOTORS
can buy at good price that is cmp
follow the line
red as SL
good above Yellow
Blue is target

special Diwali pick for you – Tata Motors"Tata Motors has been performing well recently, showing a steady uptrend in its price action. It's a prominent name in the auto sector, and its stock is currently trading at an attractive level. We believe it offers a great opportunity for potential gains."
"Now, let’s talk about the technicals. Tata Motors is currently trading at , and we see a strong support level around ₹855. This level is acting as a solid base, indicating potential for a reversal or a continued uptrend."
"We have set a target price of ₹1,035, which aligns with the stock's previous resistance and Fibonacci retracement levels. This target represents a healthy upside, with a risk-reward ratio of 1:2, making it an ideal pick for a swing trade or short-term investment."
"As always, it's crucial to manage risk. Set your stop-loss at ₹855 to protect your capital in case the market turns against us. This ensures that even if the trade doesn't work out, your losses are limited."
"To sum up, Tata Motors is a strong Diwali pick due to its robust technical setup, favorable risk-reward ratio, and overall positive outlook. Buying at the current price, with a stop loss at ₹855 and a target of ₹1,035, could be a profitable trade."
"Thank you for visit. Stay tuned for more Diwali picks and updates on the stock market. Until next time, happy trading!"

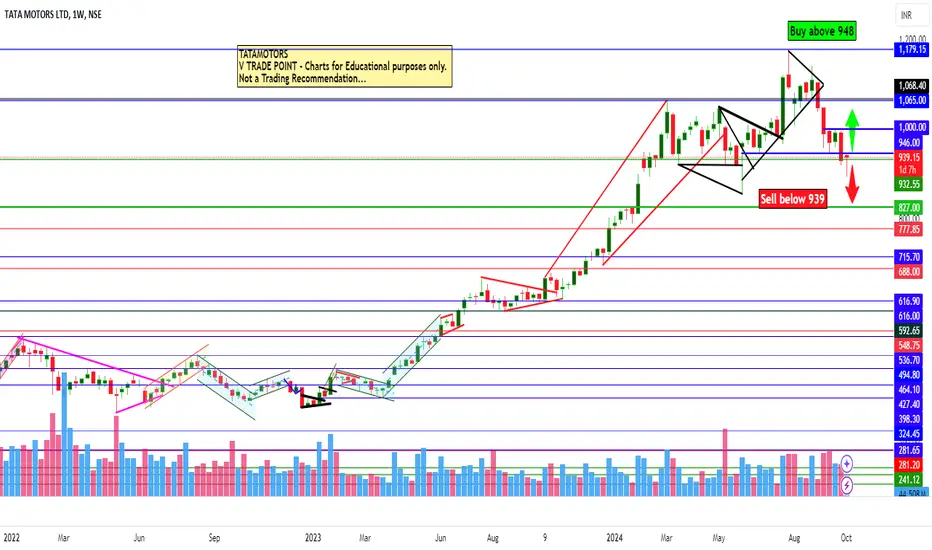
TATA Motors Ltd view for Intraday 10th October #TATAMOTORS TATA Motors Ltd view for Intraday 10th October #TATAMOTORS
Buying may witness above 948
Support area 939-940. Below ignoring buying momentum for intraday
Selling may witness below 939
Resistance area 948-950
Above ignoring selling momentum for intraday
Charts for Educational purposes only.
Please follow strict stop loss and risk reward if you follow the level.
Thanks,
V Trade Point
Tata Motors: Testing Weak Support, Short-Term Levels in FocusNSE:TATAMOTORS : Testing Weak Support, Short-Term Levels in Focus
NSE:TATAMOTORS is showing signs of weakness as it approaches crucial support levels, with a mixed outlook on the near-term trend.
Weak Support: 915 – This is the immediate support level, but it's showing signs of vulnerability. A break below could accelerate downside pressure.
Short-Term Support: 875 – If 915 fails, expect price action to test this stronger support zone, which could act as a potential buying zone for short-term traders looking for a reversal opportunity.
Resistance Levels: 965 / 1045 – These resistance zones are significant for any bullish reversal. A break above 965 could trigger short-term gains, but 1045 remains the key barrier for further upward momentum.
Outlook: The stock appears to be in a consolidation phase, testing support levels. Close attention to price action is crucial around these zones as a breakdown of 915 could lead to further downside, while any bullish reversal would need to reclaim 965 for a stronger trend confirmation.
Disclaimer: This analysis is for educational purposes only. Please conduct your own research or consult a financial advisor before making any trading decisions.

Ascending Triangle Pattern in Tata MotorsWatch out TATAMOTORS for an ascending triangle pattern breakout.
Wait for higher volumes. If moves above the red line, we can see higher levels on the yellow line.
For Research Purpose:: NOT a trade recommendation

Tata motors bearish flag sell side sell side flag formed in tata motors. target expected at 885 on sell side.

TATA MOTORS S/R for 4/10/24Support and Resistance Levels:
Support Levels: These are price points (green line/shade) where a downward trend may be halted due to a concentration of buying interest. Imagine them as a safety net where buyers step in, preventing further decline.
Resistance Levels: Conversely, resistance levels (red line/shade) are where upward trends might stall due to increased selling interest. They act like a ceiling where sellers come in to push prices down.
Breakouts:
Bullish Breakout: When the price moves above resistance, it often indicates strong buying interest and the potential for a continued uptrend. Traders may view this as a signal to buy or hold.
Bearish Breakout: When the price falls below support, it can signal strong selling interest and the potential for a continued downtrend. Traders might see this as a cue to sell or avoid buying.
20 EMA (Exponential Moving Average):
Above 20 EMA(50 EMA): If the stock price is above the 20 EMA, it suggests a potential uptrend or bullish momentum.
Below 20 EMA: If the stock price is below the 20 EMA, it indicates a potential downtrend or bearish momentum.
Trendline: A trendline is a straight line drawn on a chart to represent the general direction of a data point set.
Uptrend Line: Drawn by connecting the lows in an upward trend. Indicates that the price is moving higher over time. Acts as a support level, where prices tend to bounce upward.
Downtrend Line: Drawn by connecting the highs in a downward trend. Indicates that the price is moving lower over time. It acts as a resistance level, where prices tend to drop.
RSI: RSI readings greater than the 70 level are overbought territory, and RSI readings lower than the 30 level are considered oversold territory.
Combining RSI with Support and Resistance:
Support Level: This is a price level where a stock tends to find buying interest, preventing it from falling further. If RSI is showing an oversold condition (below 30) and the price is near or at a strong support level, it could be a good buy signal.
Resistance Level: This is a price level where a stock tends to find selling interest, preventing it from rising further. If RSI is showing an overbought condition (above 70) and the price is near or at a strong resistance level, it could be a signal to sell or short the asset.
Disclaimer:
I am not a SEBI registered. The information provided here is for learning purposes only and should not be interpreted as financial advice. Consider the broader market context and consult with a qualified financial advisor before making investment decisions.

TATA Motors Ltd view for Intraday 3rd October #TATAMOTORS TATA Motors Ltd view for Intraday 3rd October #TATAMOTORS
Buying may witness above 973
Support area 965. Below ignoring buying momentum for intraday
Selling may witness below 955
Resistance area 965
Above ignoring selling momentum for intraday
Charts for Educational purposes only.
Please follow strict stop loss and risk reward if you follow the level.
Thanks,
V Trade Point

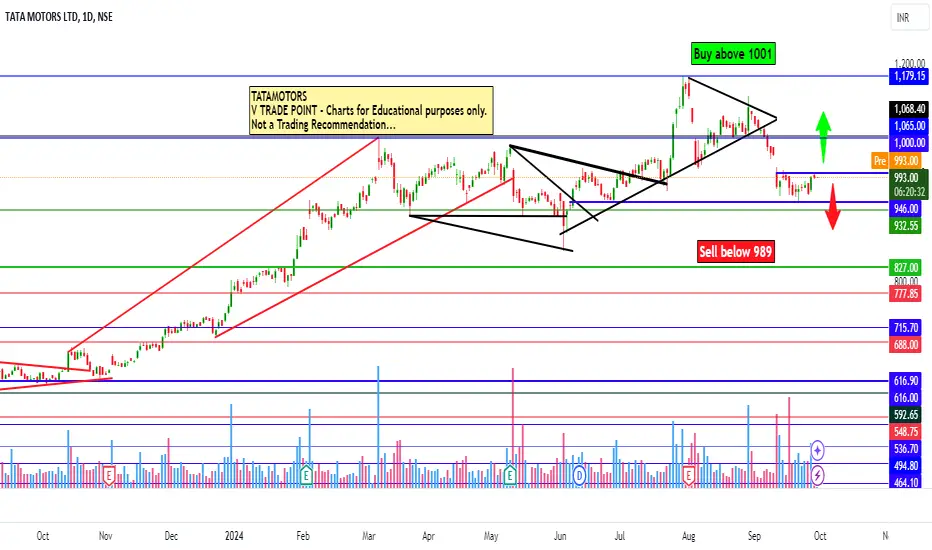
Tata Motors ltd view for Intraday 30th September #TATAMOTORS Tata Motors ltd view for Intraday 30th September #TATAMOTORS
Buying may witness above 1001
Support area 988-990. Below ignoring buying momentum for intraday
Selling may witness below 989
Resistance area 1000
Above ignoring selling momentum for intraday
Charts for Educational purposes only.
Please follow strict stop loss and risk reward if you follow the level.
Thanks,
V Trade Point

BUY at zone - swing / intradayENTRY
- lines marked below is potential reversal zone ( PRZ)
- entry is strictly inside the zone
- look for buying confirmation in smaller time frame ( 15 minutes preferred )
EXIT
1. target
- mark fib retracement from C to latest swing low
- TGT 1 - 0.236 fib level ( intraday tgt)
- TGT 2 - 0.382 fib level
- TGT 3 - 0.5 fib level ( preferred target )
2. SL
- candle close below (PRZ)
- if u didn't get confirmation inside the zone , ignore this pick
- if candle close is below zone , this pattern becomes invalid . IGNORE THIS PICK
- RE-ENTRY can be done , if u again get buying confirmation inside the zone
