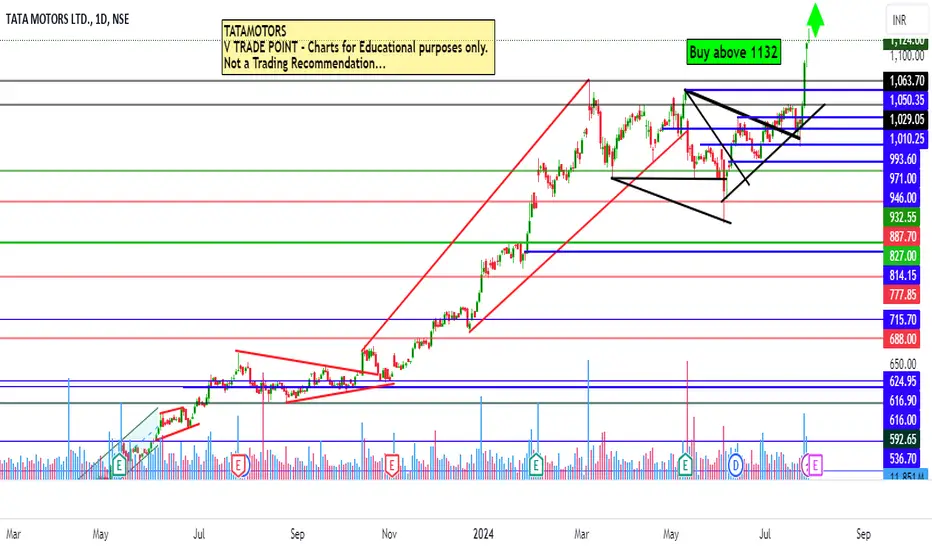
Tata Motors Intraday level for 30th July #TATAMOTORS Tata Motors Intraday level for 30th July #TATAMOTORS
Buying may witness above 1132
Support area 1110-1115. Below ignoring buying momentum for intraday
Charts for Educational purposes only.
Please follow strict stop loss and risk reward if you follow the level.
Thanks,
V Trade Point
TATAMOTORS trade ideas
TATA MOTORS S/R for 29/7/24Support and Resistance Levels: In technical analysis, support and resistance levels are significant price levels where buying or selling interest tends to be strong. They are identified based on previous price levels where the price has shown a tendency to reverse or find support.
Support levels are represented by the green line and green shade, indicating areas where buying interest may emerge to prevent further price decline.
Resistance levels are represented by the red line and red shade, indicating areas where selling pressure may arise to prevent further price increases. Traders often consider these levels as potential buying or selling opportunities.
Breakouts: Breakouts occur when the price convincingly moves above a resistance level (red shade) or below a support level (green shade). A bullish breakout above resistance suggests the potential for further price increases, while a bearish breakout below support suggests the potential for further price declines. Traders pay attention to these breakout signals as they may indicate the start of a new trend or significant price movement.
20 EMA: The yellow line denotes 20 EMA, to interpret the 20 EMA, you need to compare it with the prevailing stock price. If the stock price is below the 20 EMA, it signals a possible downtrend. But if the stock price is above the 20 EMA, it signals a possible uptrend.
Disclosure: I am not SEBI registered. The information provided here is for learning purposes only and should not be interpreted as financial advice. It is important to consult with a qualified financial advisor before making any investment decisions. Tweets neither advice nor endorsement.

NSE: TATAMOTORS / NYSE:TTM - Tata Motors - Tesla Love affair ⚡Will electric mobility wave will take Tata motors to next level? Time will tell - Can we do some crystal gazing with Chart patterns ...:)
NSE: TATAMOTORS / NYSE:TTM - Tata Motors - Tesla Love affair ⚡
Tata Motors Limited is an Indian multinational automotive manufacturing company headquartered in Mumbai, Maharashtra, India. It is a part of Tata Group, an Indian conglomerate. Its products include passenger cars, trucks, vans, coaches, buses, sports cars, construction equipment and military vehicles.
Formerly it was known as Tata Engineering and Locomotive Company (TELCO). Tata Motors has auto manufacturing and assembly plants in Jamshedpur, Pantnagar, Lucknow, Sanand, Dharwad, and Pune in India, as well as in Argentina, South Africa, Great Britain, and Thailand. It has research and development centres in Pune, Jamshedpur, Lucknow, and Dharwad, India and South Korea, Great Britain, and Spain. Tata Motors' principal subsidiaries purchased the English premium car maker Jaguar Land Rover (the maker of Jaguar and Land Rover cars) and the South Korean commercial vehicle manufacturer Tata Daewoo. Tata Motors has a bus-manufacturing joint venture with Marcopolo S.A. (Tata Marcopolo), a construction-equipment manufacturing joint venture with Hitachi (Tata Hitachi Construction Machinery), and a joint venture with Fiat Chrysler which manufactures automotive components and Fiat Chrysler and Tata branded vehicles.
Founded in 1945 as a manufacturer of locomotives, the company manufactured its first commercial vehicle in 1954 in a collaboration with Daimler-Benz AG, which ended in 1969. Tata Motors entered the passenger vehicle market in 1988 with the launch of the TataMobile followed by the Tata Sierra in 1991, becoming the first Indian manufacturer to achieve the capability of developing a competitive indigenous automobile. In 1998, Tata launched the first fully indigenous Indian passenger car, the Indica, and in 2008 launched the Tata Nano, the world's cheapest car. Tata Motors acquired the South Korean truck manufacturer Daewoo Commercial Vehicles Company in 2004 and purchased Jaguar Land Rover from Ford in 2008.
Tata Motors is listed on the BSE (Bombay Stock Exchange), where it is a constituent of the BSE SENSEX index, the National Stock Exchange of India, and the New York Stock Exchange. The company is ranked 265th on the Fortune Global 500 list of the world's biggest corporations as of 2019

TATA MOTORS - NEW JOURNEY GOING TO START?Tata Motors is on the verge of Multi Year Breakout. Good closing in week TF i.e. above 575 required. Can double from here also.
PS: For educational purpose only.

Keep eye on tata motors Tata motors give life tym high on yesterday and it also done a good breakout in rsi and price action chart we are bullish in it
Buy it at 1048-1069
Target 1160 1200 1264
Sl 1027

Keep eye on tata motors Tata motors give life tym high on yesterday and it also done a good breakout in rsi and price action chart we are bullish in it
Buy it at 1048-1069
Target 1160 1200 1264
Sl 1027

TATA MOTORSTata motors gave a breakout of 1063 levels.
We may see a new high of 1200 as a follow-up of this breakout.
Similar move was seen in tata motors DVR.
Stock pe is 11 vs sector pe of 39.
Improving results and reducing debts and upcoming demerger is a good trigger.


TATA MOTORS Breakout happend in this stock with rising 200dma.
Keep your risk and reward ratios according to your own preferance.
This is for educational purpose, do your own research before investing.

MACD Crossover Swing Trade - TATAMOTORS📊 Script: TATAMOTORS
📊 Sector: Automobile
📊 Industry: Automobiles - LCVs / HCVs
⏱️ C.M.P 📑💰- 989
🟢 Target 🎯🏆- 1050
⚠️ Stoploss ☠️🚫 - 962
⚠️ Important: Always maintain your Risk & Reward Ratio.
✅Like and follow to never miss a new idea!✅
Disclaimer: I am not SEBI Registered Advisor. My posts are purely for training and educational purposes.
Eat🍜 Sleep😴 TradingView📈 Repeat 🔁
Happy learning with trading. Cheers!🥂


TATA MOTORS BULL FLAG BREAKOUT INCOMING??Tata Motors is on the move! Our latest earnings report shows a breakout performance with impressive growth in revenue and profitability. We’re accelerating towards a future of innovation and sustainability, powered by our dedicated team and loyal customers. Stay tuned for more milestones as we drive forward.

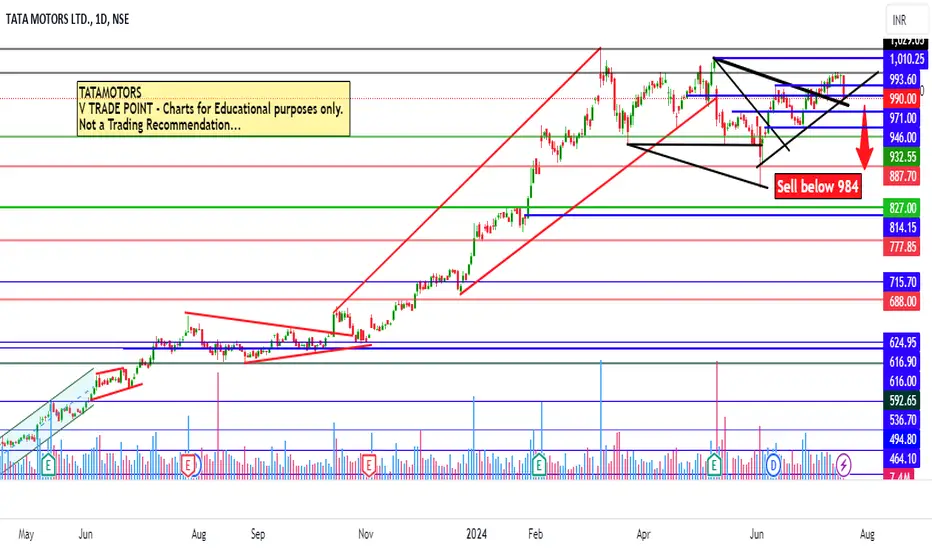
Tata Motors Intraday level for 22nd July #BHARATFORG Tata Motors Intraday level for 22nd July #BHARATFORG
Selling may witness above 984
Resistance area 1000. Below ignoring selling momentum
Charts for Educational purposes only.
Please follow strict stop loss and risk reward if you follow the level.
Thanks,
V Trade Point
Tatamotors Insurance Intraday level for 19th July #TATAMOTORS Tatamotors Insurance Intraday level for 19th July #TATAMOTORS
Buying may witness above 1030
Support area 1016. Below ignoring buying momentum
Charts for Educational purposes only.
Please follow strict stop loss and risk reward if you follow the level.
Thanks,
V Trade Point

Tata Motors Intraday level for 18th July #TATAMOTORS Tata Motors Intraday level for 18th July #TATAMOTORS
Buying may witness above 1030
Support area 1013-1016. Below ignoring selling momentum
Charts for Educational purposes only.
Please follow strict stop loss and risk reward if you follow the level.
Thanks,
V Trade Point

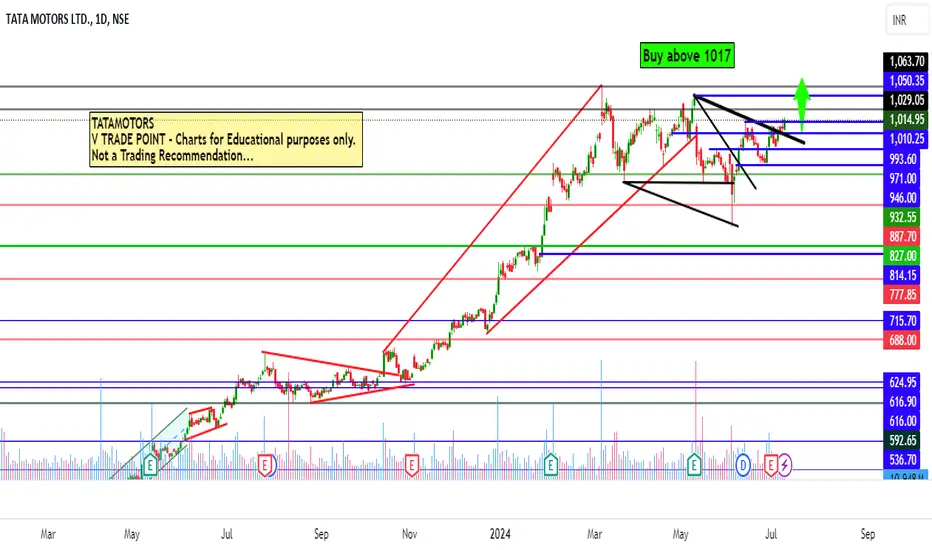
Tatamotors Intraday level for 10th July #TATAMOTORS Tatamotors Intraday level for 10th July #TATAMOTORS
Buying opportunity above 1017
Support area 1000-1003. Below ignoring buying opportunity
Charts for Educational purposes only.
Please follow strict stop loss and risk reward if you follow the level.
Thanks,
V Trade Point
Tata Motors Intraday level for 9th July #TATAMOTORS Tata Motors Intraday level for 9th July #TATAMOTORS
Buying opportunity above 1010
Support area 998-1000. Below ignoring buying opportunity
Charts for Educational purposes only.
Please follow strict stop loss and risk reward if you follow the level.
Thanks,
V Trade Point

Tata Motors : 15% Up Move is likely Tata Motors:
1. 1010 is a key level to observe for on a daily closing basis.
2. Once closes above 1010 on Daily the 975 will remain as a Swing Low and will act as a Stop Loss
3. Targets are depicted on the Chart, in this case
BUT
In case we see a liquidity sweep or Grab around 1,010 the counter may test 925-935 levels.

Tata Motors Ltd Intraday level for 2nd July #TATAMOTORS
Tata Motors Ltd Intraday level for 2nd July #TATAMOTORS
Buying opportunity above 1001
Stop Loss area 990
Charts for Educational purposes only.
Please follow strict stop loss and risk reward if you follow the level.
Thanks,
V Trade Point

Tata Motors Ltd Intraday level for 1st July #TATAMOTORS Tata Motors Ltd Intraday level for 1st July #TATAMOTORS
Buying opportunity above 996
Stop Loss area 985
Charts for Educational purposes only.
Please follow strict stop loss and risk reward if you follow the level.
Thanks,
V Trade Point

TATA MOTORS S/R for 1/7/24Support and Resistance Levels: In technical analysis, support and resistance levels are significant price levels where buying or selling interest tends to be strong. They are identified based on previous price levels where the price has shown a tendency to reverse or find support.
Support levels are represented by the green line and green shade, indicating areas where buying interest may emerge to prevent further price decline.
Resistance levels are represented by the red line and red shade, indicating areas where selling pressure may arise to prevent further price increases. Traders often consider these levels as potential buying or selling opportunities.
Breakouts: Breakouts occur when the price convincingly moves above a resistance level (red shade) or below a support level (green shade). A bullish breakout above resistance suggests the potential for further price increases, while a bearish breakout below support suggests the potential for further price declines. Traders pay attention to these breakout signals as they may indicate the start of a new trend or significant price movement.
20 EMA: The yellow line denotes 20 EMA, to interpret the 20 EMA, you need to compare it with the prevailing stock price. If the stock price is below the 20 EMA, it signals a possible downtrend. But if the stock price is above the 20 EMA, it signals a possible uptrend.
Disclosure: I am not SEBI registered. The information provided here is for learning purposes only and should not be interpreted as financial advice. It is important to consult with a qualified financial advisor before making any investment decisions. Tweets neither advice nor endorsement.

Tata Motors Ltd.*Tata Motors Ltd*
Inverse H&S on Yearly Basis.
P&F on Monthly Basis.
Price BreakOut Needed & Sustaine. To be Watched.
Strong Vol Consolidation & Continued Traction gaining.
RSI: 1H>D=W<M. All in Bullish Zone.
EMAs: Widening Gaps amongst 20/ 50/ 100/ 200 levels on Monthly Basis.
*Trail SL with Upside*
*Book Profit as per Risk Appetite*
*Do your own research as well. This is an Opinion.*
*_Happy Investing_*🤓
