Tata Motors Limited Intraday level for 27th June #TATAMOTORS Tata Motors Limited Intraday level for 27th June #TATAMOTORS
Selling opportunity below 949
Stop Loss area 960
Charts for Educational purposes only.
Please follow strict stop loss and risk reward if you follow the level.
Thanks,
V Trade Point
TATAMOTORS trade ideas

Tata Motors Ltd Intraday level fo 26th June #TATAMOTORS Tata Motors Ltd Intraday level fo 26th June #TATAMOTORS
Selling opportunity below 949
Stop Loss area 960
Charts for Educational purposes only.
Please follow strict stop loss and risk reward if you follow the level.
Thanks,
V Trade Point

Tata Motors Intraday level fo 25th June #TATAMOTORSTata Motors Intraday level fo 25th June #TATAMOTORS
Selling opportunity below 949
Stop Loss area 960
Charts for Educational purposes only.
Please follow strict stop loss and risk reward if you follow the level.
Thanks,
V Trade Point

Tatamotors intraday level fo24th June #tatamotros
Tatamotors intraday level fo24th June #tatamotros
Selling opportunity below 955
Stop Loss area 970
Charts for Educational purposes only.
Please follow strict stop loss and risk reward if you follow the level.
Thanks,
V Trade Point

Tatamotors intraday level for 21st June #TATAMOTORS Tatamotors intraday level for 21st June #TATAMOTORS
Selling opportunity below 971
Stop Loss area 983
Charts for Educational purposes only.
Please follow strict stop loss and risk reward if you follow the level.
Thanks,
V Trade Point

above 21 sme on 2nd candel in 3 or 5 minutes chart should buy above 21 sme on 2nd green candel for confirm buy then green line turn up and red line turn downand also when williams%R when low -99% then should BUY

TATA MOTORS Intraday level fo 14th June #TATAMOTORS TATA MOTORS Intraday level fo 14th June #TATAMOTORS
Buying opportunity above 993
Stop Loss area 985
Charts for Educational purposes only.
Please follow strict stop loss and risk reward if you follow the level.
Thanks,
V Trade Point

Tata Motors Ltd Intraday level for today 12th June 2024 #TATAMOTTata Motors Ltd Intraday level for today 12th June 2024 #TATAMOTORS
Buying opportunity above 993
Stop Loss area 982-985
Charts for Educational purposes only.
Please follow strict stop loss and risk reward if you follow the level.
Thanks,
V Trade Point

Tata Motors Looking bullishTata Motors completes the Inverted H&S pattern today and is looking bullish for the medium to long term with a horizon of INR 1000/- (almost double the price today).

TATA MOTORS S/R Support and Resistance Levels: In technical analysis, support and resistance levels are significant price levels where buying or selling interest tends to be strong. They are identified based on previous price levels where the price has shown a tendency to reverse or find support.
Support levels are represented by the green line and green shade, indicating areas where buying interest may emerge to prevent further price decline.
Resistance levels are represented by the red line and red shade, indicating areas where selling pressure may arise to prevent further price increases. Traders often consider these levels as potential buying or selling opportunities.
Breakouts: Breakouts occur when the price convincingly moves above a resistance level (red shade) or below a support level (green shade). A bullish breakout above resistance suggests the potential for further price increases, while a bearish breakout below support suggests the potential for further price declines. Traders pay attention to these breakout signals as they may indicate the start of a new trend or significant price movement.
Disclosure: I am not SEBI registered. The information provided here is for learning purposes only and should not be interpreted as financial advice. It is important to consult with a qualified financial advisor before making any investment decisions. Tweets neither advice nor endorsement.

Tata Motors Intraday level for today #TATAMOTORS Tata Motors Intraday level for today #TATAMOTORS
Buying opportunity above 946
Stop Loss area 938
Charts for Educational purposes only.
Please follow strict stop loss and risk reward if you follow the level.
Thanks,
V Trade Point

Cholafin Intraday level for today #CHOLAFIN Cholafin Intraday level for today #CHOLAFIN
Buying opportunity above 935
Stop Loss area 925
Charts for Educational purposes only.
Please follow strict stop loss and risk reward if you follow the level.
Thanks,
V Trade Point

Tata Motors-1-Chart AnalysisTata motors CMP:953.95; RSI: 55;
Tata motors, chart is showing signs of fatigue and weakness, is poised to slide into consolidation phase and may retrace- back to a zone of (Rs 840-775) . Tata motors is fundamentally strong counter will be a good buy in a zone at 800-850. Sentiment may reverse for a momentarily if script closes above breakout ceiling of 1070 on closing basis for 2 consecutive days, then swing-target of 1220 is also possible.
On long term basis Target-1 is positioned at 1550 level and new leg of rally may take script to 2020 levels in 10 to 12 months’ time frame.
As of now no new position should be taken in the script, those who hold the script should keep a strict stop loss of Rs: 898.
New position should taken either at 800-850 level or on breakout confirmation @1070 .
✅If you resonate with the Ideas, pls Share, Like & boost ideas and follow to never miss a new idea! ✅

Tata Motors seems at right opportunity to buy Tata Motors seems at right opportunity to buy now as per indicated range.
This is for analysis purpose only. Trade on your risk.

Swing trading idea on TATAMOTORSTATAMOTORS has been trading within the channel pattern for quite some time now. With the formation of hammer at the support level indicates an ideal entry point for a short swing with target at next resistance level. Entry can be held just above todays high that would provide an ideal risk reward of 1: 2.5. There are quite a lot of stocks that has given entry at key support levels unfortunately, I couldn't name it all here as I study every stock individually.
If you like this idea, please boost this idea or leave a comment down on what you think. Otherwise happy trading :-).

TATAMOTORS Support Breach: Bullish Opportunity!🚨 Stock Update: TATAMOTORS 🚨
Date : 16-05-2024
TATAMOTORS breached major support today due to heavy selling pressure and closed at 936.40. I expect the stock to consolidate for a while, which presents a good opportunity to accumulate.
I'm bullish on this stock and plan to buy small quantities below 930 with a stop loss at the next support level (872.10) . My initial target is 1069 .
Stay tuned for important updates and adjustments. Upvote and follow for regular updates! 📈💼

TATA MOTORS S/R Support and Resistance Levels: In technical analysis, support and resistance levels are significant price levels where buying or selling interest tends to be strong. They are identified based on previous price levels where the price has shown a tendency to reverse or find support.
Support levels are represented by the green line and green shade, indicating areas where buying interest may emerge to prevent further price decline.
Resistance levels are represented by the red line and red shade, indicating areas where selling pressure may arise to prevent further price increases. Traders often consider these levels as potential buying or selling opportunities.
Breakouts: Breakouts occur when the price convincingly moves above a resistance level (red shade) or below a support level (green shade). A bullish breakout above resistance suggests the potential for further price increases, while a bearish breakout below support suggests the potential for further price declines. Traders pay attention to these breakout signals as they may indicate the start of a new trend or significant price movement.
Disclosure: I am not SEBI registered. The information provided here is for learning purposes only and should not be interpreted as financial advice. It is important to consult with a qualified financial advisor before making any investment decisions. Tweets neither advice nor endorsement.

Intraday levels for today 04th June 2024 #TATAMOTORS Intraday levels for today 04th June 2024 #TATAMOTORS
Buying opportunity above 962
Support area around 950
Charts for Educational purposes only.
Not a Trading opportunity
Follow strict risk reward and stop loss if you follow the levels
Thanks,
V Trade Point

TATA MOTORS S/R for 4/6/24Support and Resistance Levels: In technical analysis, support and resistance levels are significant price levels where buying or selling interest tends to be strong. They are identified based on previous price levels where the price has shown a tendency to reverse or find support.
Support levels are represented by the green line and green shade, indicating areas where buying interest may emerge to prevent further price decline.
Resistance levels are represented by the red line and red shade, indicating areas where selling pressure may arise to prevent further price increases. Traders often consider these levels as potential buying or selling opportunities.
Breakouts: Breakouts occur when the price convincingly moves above a resistance level (red shade) or below a support level (green shade). A bullish breakout above resistance suggests the potential for further price increases, while a bearish breakout below support suggests the potential for further price declines. Traders pay attention to these breakout signals as they may indicate the start of a new trend or significant price movement.
Disclosure: I am not SEBI registered. The information provided here is for learning purposes only and should not be interpreted as financial advice. It is important to consult with a qualified financial advisor before making any investment decisions. Tweets neither advice nor endorsement.


Clear Breakout for " TATA Motors " Guy's Clear Breakout for TATA Motors , Support & Resistance is Given
I Am Not SEBI Registered Analyst. All Post and Levels Posting is only for educational and knowledge purpose. I Am not responsible for your any kind of loss or profit.
No Claim, All Rights Reserved.‼️

Intraday Level for Tata Motors for 30th MayIntraday Level for Tata Motors for 30th May
#TATAMOTORS
Selling opportunity for intraday below 935
Stop loss area around 950
Charts for Educational purposes only.
Please follow strict Risk Reward and Stop Loss if you follow the levels.
Thanks,
V Trade Point.
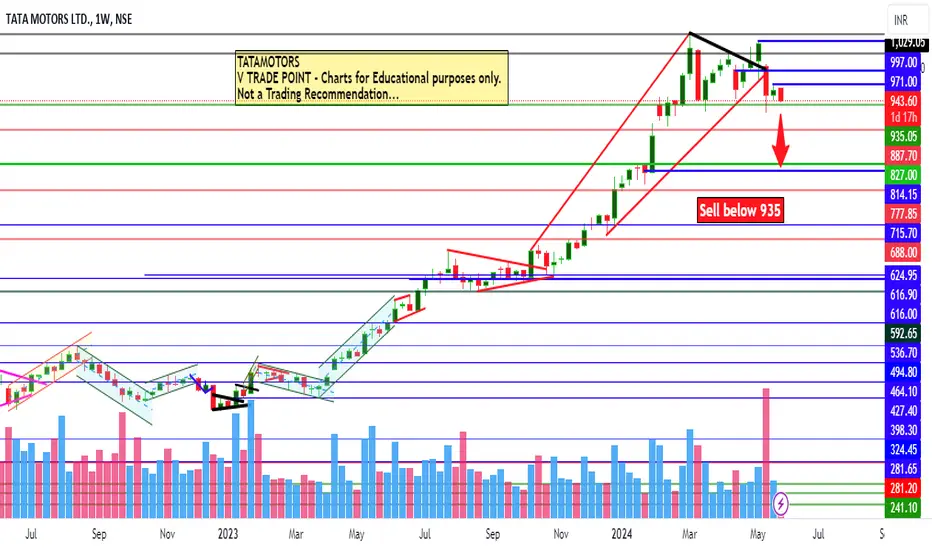
Intraday view for Tata Motors for today #TATAMOTORS Intraday view for Tata Motors for today #TATAMOTORS
Selling opportunity may witness below 935
Resistance area area around 950
Charts for Educational purposes only.
Not a Trading Recommendation.
Please strictly follow Risk Reward and Stop Loss if you follow the levels.
Thanks,
V Trade Point
