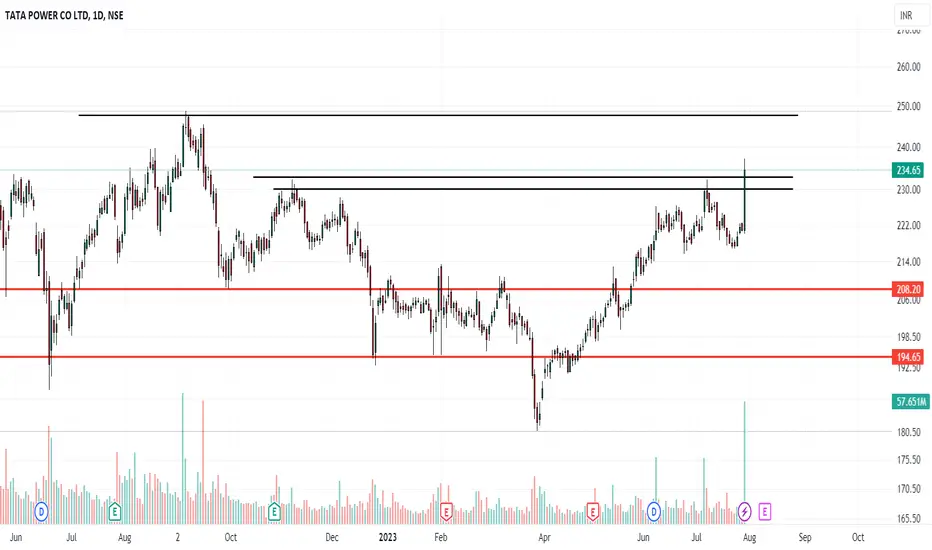
Resistance BreakoutPlease look into the chart for a detailed understanding.
Consider these for short-term & swing trades with 2% profit.
For BTST trades consider booking
target for 1% - 2%
For long-term trades look out for resistance drawn above closing.
Please consider these ideas for educational purpose
TATAPOWER trade ideas
Tata Power Showing Power on chartStock: TATA POWER
Position: Long
Reasons for the position: Breakout
The stock market is volatile and there is no guarantee that TATA POWER Ltd will continue to perform well in the future.
The company faces competition from other companies in the same industry.
The company is subject to risks associated with its industry, such as changes in government regulations or economic conditions.
Happy Trading

TATA POWER READY TO MOVE.the chart itself explains each and every thing about the price and stock
SMART MONEY CONCEPTS are been used

Tata power Forming cup and handle.. Its going to ATH soon keep under watch.. Its for knowledge sharing

More than 88 weeks (22mths) consolidation on a weekly time frameTata Power is in strong consolidation and watch for a breakout at Rs. 250 and is a strong resistance.

Tata power cup and holder patternTataPower has formed cup and holder pattern on 1D time frame. Ready for uptrend?

Tata power for swing Tata power looks good for swing can buy above 223 on 1 hr candle closing ,for a risk reward of 1:2 , levels marked on chart.

Tat Power Analysis Tata Power taking support on COVID trend line.
And continuing uptrend in upward channel. Near 210 looks like support.
If it sustaining 210 Level , Then we can see again all time high in next 6 to 8 months. Also We can trade weekly closing basis candle for the Intra day trading or the positional short term trading.
Follow for more such idea.

#TATAPOWERNSE:TATAPOWER
IN uptrend
1. Market move - Buyers Zone
2. Current trade positions - Bullish

TATAPOWER rising channel On the chart we can see a rising channel. Looks like the price may stay in this upsloping channel, a bit longer.
We can entry short at the upper boundary.
Invalidation of this thesis would be if the price breaks above the upsloping resistance line.

TATA POWER CO LTD Make inverted head and shoulder chart pattern in 4 hour time fram , 50 EMA cross 100 EMA from below that's bullish Sign , history saw strength MACD line also saw fair value so first Target will be 240.25 and stop loss will be 211.50
This is for educational purpose not a trading advice so that's my view comment down your view 🤗

TATA power targer 280 In within 3 monthhi every one
buy tatat power 200 rs
target 280
return on investment 90%
you can check 3 month candle stick chart you find clue

tata power break out donetata power break out done which was price of 110 112 which was heavy resistance now this stock has become multibagger target is 250 sec target 30 and inside you can take entry Take it but this is only for education purpose you will be responsible for both profit and loss my duty technical analysis is only for educational purpose

TATA POWER ON A BREAKOUTA strong company named NSE:TATAPOWER is on a line of breakout after it move above a price of 215, once it moves above 215 takes a bull call with a target price of 228 and a stoploss of 202 having a 1:1 risk to reward ratio.
Thanks
it's just my setup...!

Tata power break out of Channel, Ready for 224 and 235Tata power break out and retest of Channel, Ready for 224 and 235

TATA POWER, LONG 115, 130TATA POWER, RETEST done, small stop loss, likely to reach 115, 130 in short term. CUP and handle pattern

Buy tatapowerBuy tatapower 10-20% target 1month holding.
Buy tatapower 10-20% target 1month holding.

TATA POWER (10/4/2023)NSE:TATAPOWER
if it touches 197 and start falling
then sell at 170 level.retracement is mandatory
but more chance it will form w and will go up . normal market conditio is bullish now a days.All important levels are drawn in the chart.Work with risk reward ratio. not taking a trade is also a trade.
A trade cant change anything keep in your mind,if you think one trade can change your life then you are doing gambling in the market.take calculated risk.

#TATAPOWER: Falling Wedge Formation with Possible Breakout TATAPOWER, a stock that has been forming a falling wedge pattern with potential breakout and reversal levels.
As you can see from the chart, #TATAPOWER has been forming a falling wedge pattern, with the price oscillating between two downward sloping trendlines. This can be a bullish signal, as the stock is trading in a contracting range and may be preparing for a breakout to the upside.
A breakout could occur if the stock closes above the 210 level, which would indicate a potential reversal in the short-term downtrend. It's important to keep in mind that a breakout is not guaranteed, but it's worth keeping #TATAPOWER on your watchlist to see how the stock performs in the coming days.
In terms of support levels, there are two key levels to watch: 188 and 177. If the stock breaks below these levels, it may indicate a continuation of the downtrend and could lead to further downside.
However, if the stock does break out above 210 and shows a strong close above 208, it may be a good opportunity to buy the stock. There are potential targets for the stock at 233, 250, and 270+.
In summary, #TATAPOWER has been forming a falling wedge pattern with potential breakout and reversal levels. It's important to monitor the stock closely and wait for a strong close above 208 before considering a buy.

TATA PowerRefer my below linked study for TATA Power
Price action perfectly respected...
But the cart is still weak on a daily horizon.
have marked important price action levels.
Happy trading...
Like & Share...
Follow for more updates....

TATAPOWER looks bearish TATAPOWER
Corrective wave - descending or contracting triangle
The price already broke the level on the downside & looks like retesting the SR flip.
The next support level is 136.


TATA POWER COMING SOON... 1WNSE:TATAPOWER
support level 197. and think about
upside above 234 level.
its consolidating from many weeks.
forming triangle like pattern.
after retracement may be
super move will coming soon...
