Tata Technologies BuyTata Technologies seems to take support from trend line. Buy @CMP (735) with SL of 698 and target of 785 & 800
TATATECH trade ideas

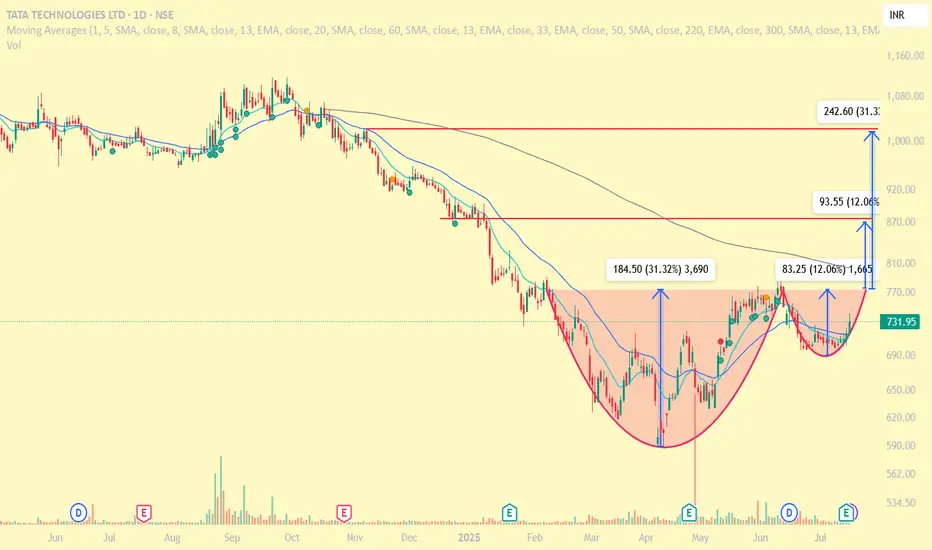
Tatatech: Formation of cup and handlethe chart shows the formation of cup and handle in progress. It may shoot the targets depending upon the market perception.
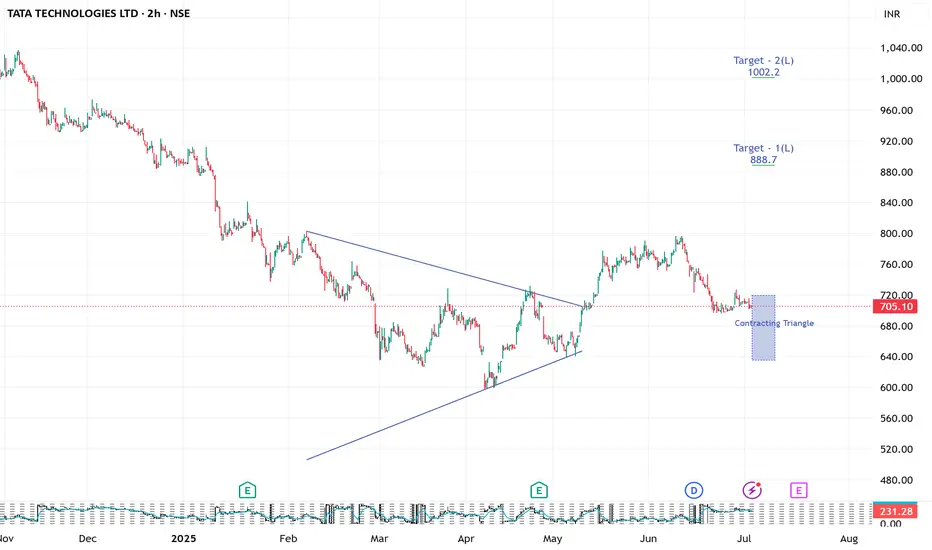
TATA TECHNOLGIES looking strong 2 hrs ( short to medium term
LOOKING stable and strong bullish contracting triangle
pattern suggest us abv 722 closing
price action may show some strength
These classic patterns sometime shows sparkle in price action
pattern may be wrong
do your analysis
this is for educational purpose
TATA TECHHere’s the **professional analysis** of your uploaded **TATA TECHNOLOGIES LTD (TATATECI) weekly chart**, like a seasoned institutional trader:
---
### ✅ **1. Market Structure**
* **Primary Trend:** Strong downtrend from ₹1,300 to ₹597. Now forming a **reversal base**.
* **Current Structure:**
* **Rounded bottom** forming after prolonged selling.
* **Higher lows** in last 4–5 candles with increasing volume — potential **bottoming out phase**.
* Price has **closed above the 20-week EMA** (blue line) — early bullish signal.
---
### ✅ **2. Key Levels**
* **Support Zone:** ₹710–₹725 (previous pullback zone + base of accumulation)
* **Immediate Resistance:** ₹827–₹850 (prior supply area)
* **Major Resistance:** ₹940–₹1000 (if breakout sustains)
---
### ✅ **3. Entry Point**
* **Swing Entry (Best Choice):**
**Buy on breakout above ₹827** (weekly closing) with volume confirmation. This confirms strength past previous resistance.
* **Aggressive Entry:**
Enter now around ₹785–₹790 with a tight stop (riskier due to resistance nearby).
---
### ✅ **4. Stop Loss & Target**
* **Stop Loss (SL):** ₹738 (below last week's low and 20EMA)
* **Target 1:** ₹865
* **Target 2:** ₹930
* **Target 3 (Positional):** ₹1,020–₹1,050
---
### ✅ **5. Risk-Reward Ratio (RRR)**
* Entry: ₹790
* SL: ₹738 → ₹52 risk
* T1: ₹865 → ₹75 reward → **RRR: 1.4**
* T2: ₹930 → ₹140 reward → **RRR: 2.7**
📌 **Institutional Notes**
* Volume supports breakout interest
* Stock showing leadership signs after steep correction
* Prefer **weekly close above ₹827** before adding large quantity

Strenght in nounce back : Tata Tech Strenght in nounce back : Tata Tech
seems like stock is bouncing back from ipo low. forming IPO base
we can expect 20 to 22% target with few months ( o.5 fib retracement marked in chart)
Sl keep trailing.
Its large cap fundamentaly good company
Review and plan for 5th June 2025 Nifty future and banknifty future analysis and intraday plan.
Positional ideas.
This video is for information/education purpose only. you are 100% responsible for any actions you take by reading/viewing this post.
please consult your financial advisor before taking any action.
----Vinaykumar hiremath, CMT

TATA TECH - Bullish Inverted H&S Breakout (Daily T/F)Trade Setup
📌 Stock: TATA TECHNOLOGIES ( NSE:TATATECH )
📌 Trend: Strong Bullish Momentum
📌 Risk-Reward Ratio: 1:3 (Favorable)
🎯 Entry Zone: ₹750.55(Breakout Confirmation)
🛑 Stop Loss: ₹699.00(Daily Closing Basis) (~5.6% Risk)
🎯 Target Levels:
₹773.45
₹795.70
₹816.35
₹840.55
₹867.00
₹896.85 (Final Target)
Technical Rationale
✅ Bullish Inverted Head & Shoulder Breakout - Classic bullish pattern confirming uptrend continuation
✅ Strong Momentum - Daily RSI >60 & Weekly RSI >50
✅ Volume Confirmation - Breakout volume 3.43M(while posting) vs previous day's 767.40K (Nearly 5x surge while posting)
✅ Multi-Timeframe Alignment - Daily and weekly charts showing strength
Key Observations
• The breakout comes with significantly higher volume, validating strength
• Well-defined pattern with clear price & volume breakout
• Conservative stop loss at recent swing low
Trade Management Strategy
• Consider partial profit booking at each target level
• Move stop loss to breakeven after Target 1 is achieved
• Trail stop loss to protect profits as price progresses
Disclaimer ⚠️
This analysis is strictly for educational purposes and should not be construed as financial advice. Trading in equities involves substantial risk of capital loss. Past performance is not indicative of future results. Always conduct your own research, consider your risk appetite, and consult a financial advisor before making any investment decisions. The author assumes no responsibility for any trading outcomes based on this information.
What do you think? Are you watching NSE:TATATECH for this breakout opportunity? Share your views in the comments!


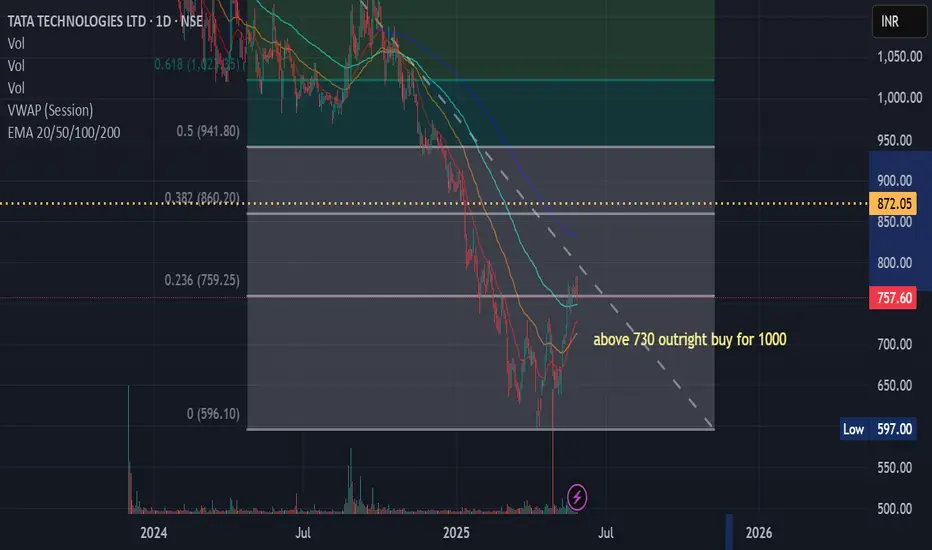
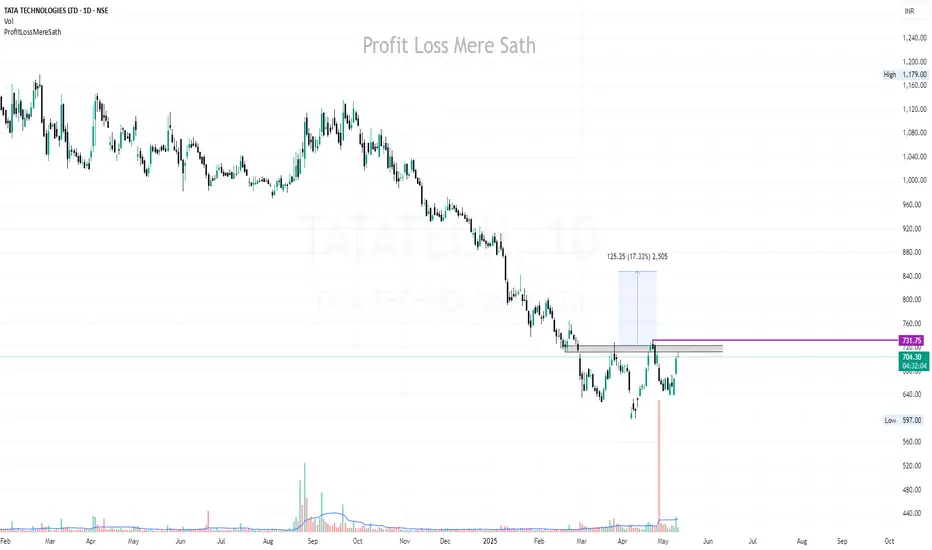
TATATECHKeep eye on TATATECH. If the price moves above 732, consider buying with a small SL.
Confirmation of the head and shoulders pattern occurs when the price breaks decisively below the neckline
Disclaimer:
This is not financial advice. Please do your own research or consult with a financial advisor before making any investment decisions. Investments in stocks can be risky and may result in loss of capital.

TATA Tech Breakout: Inverted Head & Shoulder Targets ₹856+A bullish reversal pattern forming in Tata Technologies Ltd (TATATECH) on the daily timeframe.
Pattern Identified:
📌 Inverse Head and Shoulders Pattern
Left Shoulder: Price dips and recovers
Head: A deeper dip followed by recovery
Right Shoulder: A higher low and bounce
Neckline: Resistance around ₹755 is tested multiple times
Key Technical Insights:
Breakout Above Neckline: Today's close above ₹755 confirms breakout
Target Projection:
Target = Neckline + Height (from Head to Neckline)
Projected Target = ₹856+
Volume Confirmation (optional): Typically, volume should rise during breakout for stronger confirmation
Sentiment:
Reversal from downtrend to possible uptrend
Bullish momentum expected to continue toward the ₹856+ zone

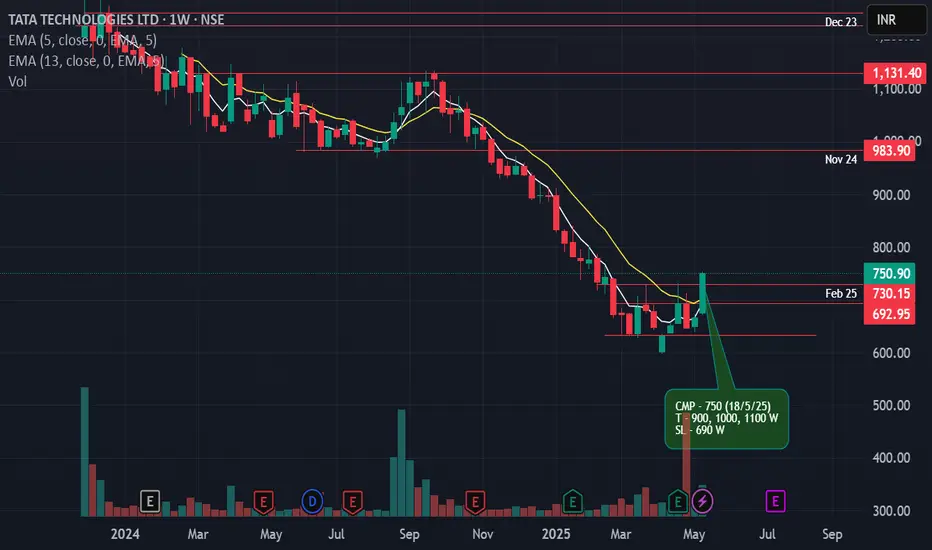
Chart of the week. Tata Tech Tata tech has given double bottom breakout this week. Since its listing @ 1200 in Dec 23, stock is continuously falling. This week after a good consolidation stock is showing strength to move up. The stock is currently trading at very fair evaluation. Its a Tata company so one can take this trade without hesitation. I personally do not recommend any sl as this trade is for investors. But if someone wants to take a trading call then use the following sl.
CMP - 750 (18/5/25)
T - 900, 1000, 1100 W
SL - 690 W
Keep eye on TATATECH. If the price moves above 732, consider buyKeep eye on TATATECH. If the price moves above 732, consider buying with a small SL.
Disclaimer:
This is not financial advice. Please do your own research or consult with a financial advisor before making any investment decisions. Investments in stocks can be risky and may result in loss of capital.
TATA Technologies Ltd view for Intraday 29th April #TATATECH TATA Technologies Ltd view for Intraday 29th April #TATATECH
Resistance 690 Watching above 691 for upside movement...
Support area 680 Below 680 ignoring upside momentum for intraday
Watching below 678 for downside movement...
Above 690 ignoring downside move for intraday
Charts for Educational purposes only.
Please follow strict stop loss and risk reward if you follow the level.
Thanks,
V Trade Point

Tata technologies long term technical analysisTata technologies long term technical analysis for 4 years it will touch around 7000 to 8000

TATA TECH - The slipping tech giantThe chart is self explanatory as always.
After forming a nice IPO range, The stock broke down.
Where do you expect this to stop?
Disclaimer: This analysis is purely for educational purposes and does not constitute trading advice. I am not a SEBI-registered advisor, and trading involves significant risk. Please consult with a financial advisor before making any investment decisions.

Tatatech is ready to go upDivergences and price action, suggest Tatatech will test 985 in coming days.
As usual SL to be in place.

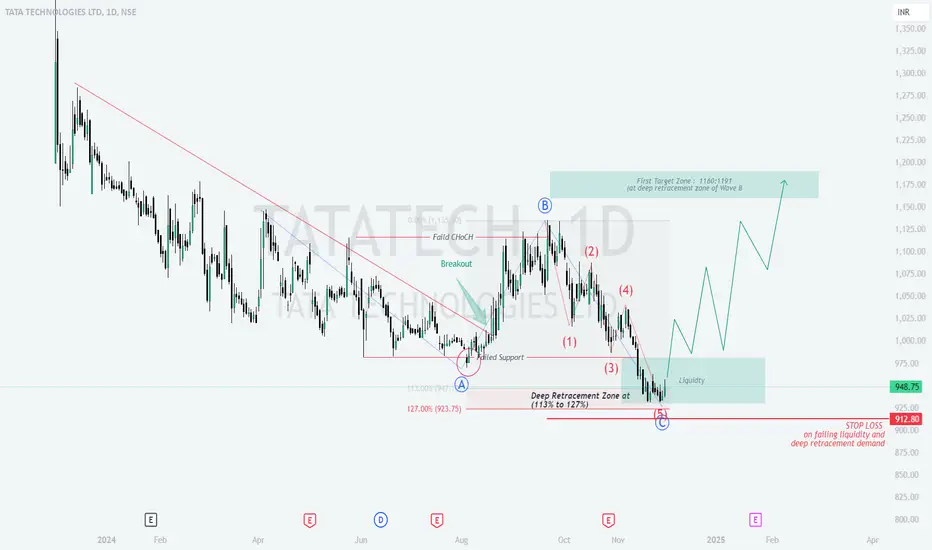
TATATECH : time to wake up now3. Tata Technologies Ltd
Analysis:
Wave Structure: A 5-wave corrective structure with Wave C reaching a deep retracement zone (113%-127% of Wave A).
Liquidity Zone: Indicates possible institutional accumulation near current levels.
Target Zone: Marked at 1160-1191 INR, aligning with Wave B retracement levels.
Stop Loss: Placed at 912.80 INR, just below the support zone.
Trading Plan:
Action: Initiate buy positions at current levels (948.75 INR) or near the 923-912 zone if prices dip.
Stop Loss: Place at 912.80 INR.
Targets:
First Target: 1160 INR.
Final Target: 1191 INR.
Reasoning:
Confluence of support in the retracement zone suggests potential for reversal.
Target aligns with historical resistance, providing logical exit levels.
Tata Technologies : Picture abhi baki haiThis has been very unique analysis for me. Technical analysis says it is bearish trend but if you see typical investor behaviour buy and forget, there seems to someone who has bought huge on 27 Aug 2024. Around 2.3cr daily volume.
Even after stock has crossed below same exit volume is not seen. Maybe exit has already happened. Maybe not. Maybe it is very long term investment.
Things not clear yet but for very long term might be a good experiment to keep on watchlist.
Maybe buy 10 qty and observe behaviour

TATA TECHTATA TECH made low as per my view it may not break 970 because it is trying to shift its range in rsi if it break recent suport there will be chance to aproach lowest low,

TATATECH S/R Support and Resistance Levels:
Support Levels: These are price points (green line/shade) where a downward trend may be halted due to a concentration of buying interest. Imagine them as a safety net where buyers step in, preventing further decline.
Resistance Levels: Conversely, resistance levels (red line/shade) are where upward trends might stall due to increased selling interest. They act like a ceiling where sellers come in to push prices down.
Breakouts:
Bullish Breakout: When the price moves above resistance, it often indicates strong buying interest and the potential for a continued uptrend. Traders may view this as a signal to buy or hold.
Bearish Breakout: When the price falls below support, it can signal strong selling interest and the potential for a continued downtrend. Traders might see this as a cue to sell or avoid buying.
20 EMA (Exponential Moving Average):
Above 20 EMA(50 EMA): If the stock price is above the 20 EMA, it suggests a potential uptrend or bullish momentum.
Below 20 EMA: If the stock price is below the 20 EMA, it indicates a potential downtrend or bearish momentum.
Trendline: A trendline is a straight line drawn on a chart to represent the general direction of a data point set.
Uptrend Line: Drawn by connecting the lows in an upward trend. Indicates that the price is moving higher over time. Acts as a support level, where prices tend to bounce upward.
Downtrend Line: Drawn by connecting the highs in a downward trend. Indicates that the price is moving lower over time. It acts as a resistance level, where prices tend to drop.
RSI: RSI readings greater than the 70 level are overbought territory, and RSI readings lower than the 30 level are considered oversold territory.
Combining RSI with Support and Resistance:
Support Level: This is a price level where a stock tends to find buying interest, preventing it from falling further. If RSI is showing an oversold condition (below 30) and the price is near or at a strong support level, it could be a good buy signal.
Resistance Level: This is a price level where a stock tends to find selling interest, preventing it from rising further. If RSI is showing an overbought condition (above 70) and the price is near or at a strong resistance level, it could be a signal to sell or short the asset.
Disclaimer:
I am not a SEBI registered. The information provided here is for learning purposes only and should not be interpreted as financial advice. Consider the broader market context and consult with a qualified financial advisor before making investment decisions.

Tatatech - IPO base breakoutTata Technologies Ltd.
IPO base breakout and consolidation.
Crossing last month high.
High trade and delivery quantity this month.
20EMA crossing 200EMA from below.
Disclaimer:
For educational purpose only.
Please do your own research before taking any trades.
Happy Trading!

Bullish Alert: Tata Technologies|Strong Swing Trade Potential!📈 Bullish Alert: Tata Technologies Ltd. Shows Strong Swing Trade Potential! 🚀
Stock Analysis Report
Stock Name : Tata Technologies Ltd.
Timeframe: Daily
Current Market Price (CMP) : ₹1068
________________________________________
Trade Type
• Trade Type: Swing Trade
________________________________________
Technical Analysis
1. Trendline Breakout:
The stock has recently broken above a key trendline with increased volume, indicating a strong bullish signal.
Following the breakout, the stock has successfully retested the trendline, further
validating the upward momentum.
2. Indicators:
MACD: Buy signal confirmed.
Oscillator: Buy signal confirmed.
3. Moving Averages:
The price is currently trading above both the 50-day and 100-day moving averages, reinforcing the positive trend.
________________________________________
Target Prices
• T-1: ₹1115
• T-2: ₹1150
• T-3: ₹1180
________________________________________
Stop Loss
• SL: ₹1045
________________________________________
Summary : Tata Technologies Ltd. presents a strong swing trade opportunity. The stock exhibits a bullish trend supported by a recent trendline breakout, successful retest, and positive signals from key technical indicators. With the price trading above significant moving averages, potential target prices are set at ₹1115, ₹1150, and ₹1180, while a stop loss is recommended at ₹1045 to manage downside risk.
________________________________________
Disclaimer : " Please do not base your trades solely on the ideas mentioned above. Conduct your own research before making any trading decisions. We are not responsible for any financial losses that may result from applying this study or from taking any early entry or exit in trades. "
