TCS trending upwardsTata Consultancy Services Ltd. is a leading global IT services, consulting and business solutions organization offering transformational as well as outsourcing services to global enterprises. The company has a global presence in multiple industry verticals and services consisting of consulting, integration, application services, digital transformation services, cloud services, engineering services and many more.
Tata Consultancy Services Ltd CMP is 3494.55. The Negative aspects of the company is high valuation (P.E. = 28.6). The Positive aspects of the company are no debt, FIIs are increasing stake, MFs are increasing stake, improving annual net profit, improving cash from operations annual.
Entry can be taken after closing above 3501. Targets in the stock will be 3582, 3682 and 3765. Long term target in the stock will be 3853+. Stop loss in the stock should be maintained at Closing below 3000.
The above information is provided for educational purpose, analysis and paper trading only. Please don't treat this as a buy or sell recommendation for the stock. We will not be responsible for any Profit or loss that may occur due to any financial decision taken based on any data provided in this message.
TCS trade ideas

TCS --Near its Demand Zones??I am sharing the important levels of Support and Resistance. These levels play a crucial role in trading decisions, as they act as reliable markers of price movements.
------>>Support levels are price points where an asset tends to find buying interest, preventing it from falling further.
---->Resistance levels, on the other hand, are points where selling pressure typically prevents the asset from rising higher.
If price breaks the resistance, we have a chance of filling the bearish gap, soo keep in buyside until it touches the zone of resistance and bearish gap.
Take a look at these levels and trade accordingly. Recognizing and respecting these support and resistance levels can help traders make informed decisions and manage risk effectively. They serve as key reference points for technical analysis and are vital tools in successful trading strategies.
Trade safe...Thank you guys for your support

TCS looking weak now we get 250 points on upside On Our Harmonic pattern indicator based trade setup take trade as explained below :-
Early trades Buy or sell below/ above 23.6 %, safe trades buy or sell above / below 41% , after taking trade next upside or downside levels will be target ,
When reverse buy or sell signal appear then book profit on Target or trail SL to 23.6 % If trailing SL hit then early trade can be taken above or below 23.6 and safe trade can b taken above/ below 41% ..
Please note:-
It's working on news based and volitile market very well so exit if SL hit

TCS Looking Strongas we can see on a daily time frame of TCS it is consolidating in a a channel and previous days closing looking good so if it crosses the level of 3640 and sustain above that , in a upcoming days we can see a good upside move in TCS

TCSNSE:TCS
One Can Enter Now !
Or Wait for Retest of the Trendline (BO) !
Or wait For better R:R ratio !
Note :
1.One Can Go long with a Strict SL below the Trendline or Swing Low.
2. R:R ratio should be 1 :2 minimum
3. Plan as per your RISK appetite and Money Management.
Disclaimer : You are responsible for your Profits and loss, Shared for Educational purpose
TCS for Chhotu bhaiya
Looking at TCS from an elliot wave perspective, seeing if it still is in wave 4 of 3 or if it potentially has started wave 5 of the bigger cycle


TCS ready for 3800+ For all trade on my Auto Harmonic patterns indicator trade setup -
Risky trades can take trade after crossing 23.6% on either side and safe traders can take trade after 41% We can start buying when our Trailing SL hit at 23.6% with SL of recent low our Target will be 41%, 78.6% , 127.2% 161.8% and 223.6 % , when reversal pattern appears on chart we have to trail our SL if trailing SL hit exit from long trade and initiate sell trade ,


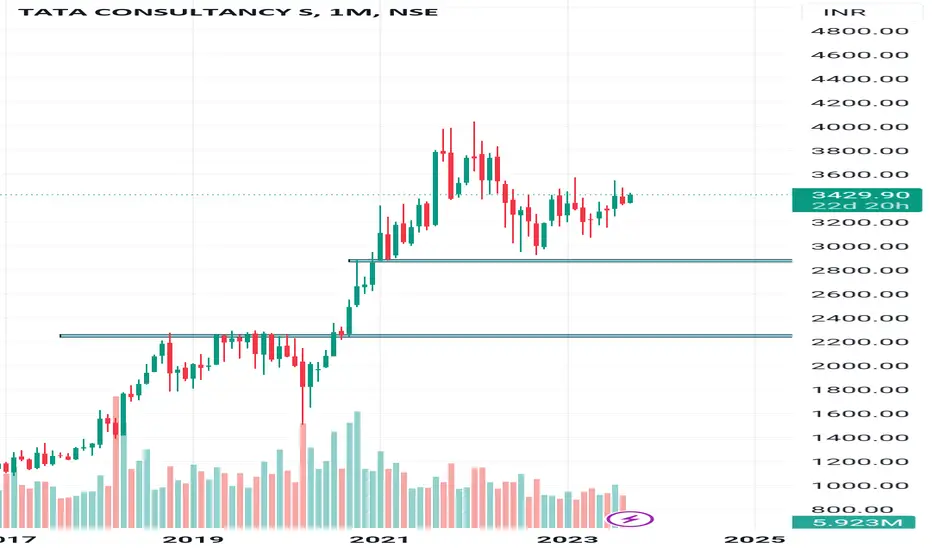
Weekly Double bottomTCS has broken out of weekly double bottom and a symmetrical triangle
Upmove confirmed?

Ascending Triangle pattern breakout in TCSTATA CONSULTANCY SERVICES LTD
Key highlights: 💡⚡
✅On 1Week Time Frame Stock Showing Breakout of Ascending triangle Pattern.
✅Strong Bullish Candlestick Form on this timeframe.
✅It can give movement up to the Breakout target of 4145+.
✅Can Go Long in this stock by placing a stop loss below 3350-.


TCSAfter very long time TCS has broken out from the triangle. Some good upside is visible on the chart but do it keep SL & position size in check

#Tcs #trendline #breakout #nsebreakout#tcs should break this trend line first. And what your analysis shows..

My prediction on TCS on daily candleMy prediction on TCS on daily candle. Please do not follow my prediction for your trade.. It is only for education purpose.

TCS LONG Sideways channel breakout with good volume
Marubozu candle on chart
Price above DEMA
Stock setup is very Bullish for long position
Macd Bullish
RSI Bullish
Best opportunity for swing Trade.
Disclaimer This is my personal view for education purpose only.

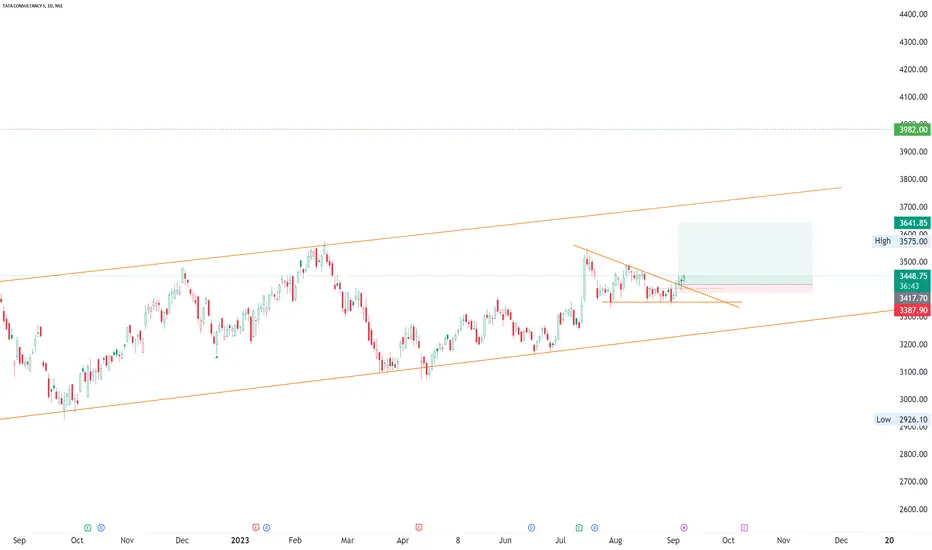
TCS--@Resistance Zone?? This stock has encountered persistent resistance within the 3460 range on multiple occasions. On the flip side, the price has consistently found support along a trendline, leading to upward movements.
It's advisable to maintain a bullish perspective as long as the price remains above this trendline. However, exercise caution, as there's a possibility of a false breakdown below the trendline, which could mislead traders and necessitate a prudent approach before considering short positions.

TCSInvestment grade pik only..Traders stay away. Investors to enter ... should give 200-300 pts upside from here

Tcs.. time to catch thus gem for longterm people Tcs.. no need of introduction.. available at discount..people who expects good returns with dividends can invest in installments
TCS AnalysisAfter a strong gapdown... price is in a range
a drop base drop is going to observe in this stock...
look for sell up to 3340-3330 levels...

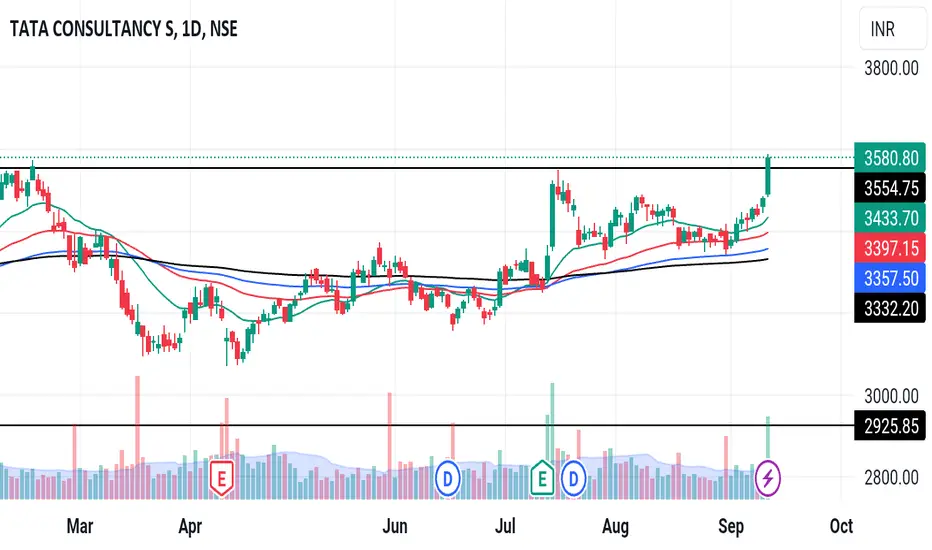
TCS - A Crucial LevelTCS remains at a crucial resistance level. While a move to 3580 could trigger a bullish scenario, price below the level has a bearish touch.
This is only an idea. Any trade/Investment should be made with proper risk management only.

buing oppurtunity,TCSstock gives a breakout with god volume .and now it is consolidating and showing highe highs and lower highs
