TCS trade ideas
TCSTCS, 15 MIN CHART
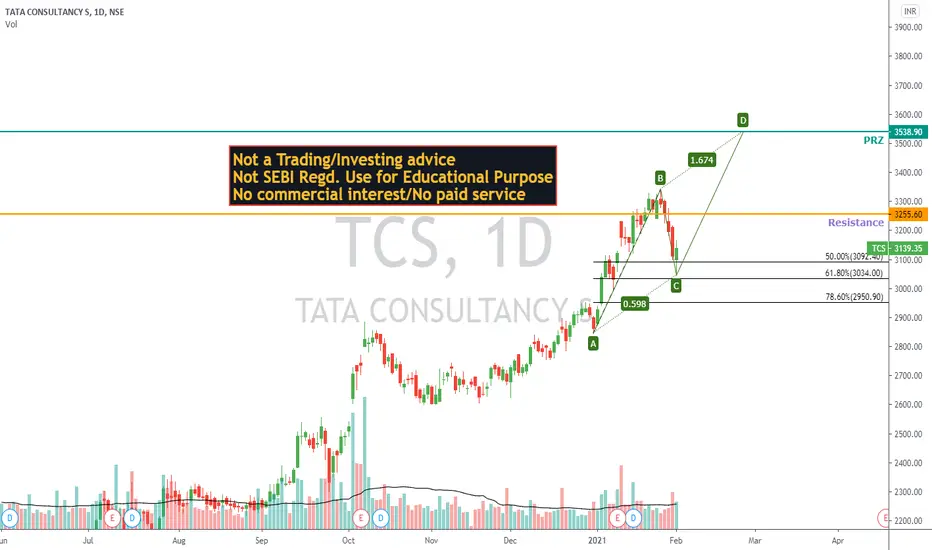
Can go towards 3275, and 3338
Stoploss below 3180
Disclaimer
I am not SEBI REGISTERED Analyst
My Studies are Educational purpose only
Consult with your financial advisor before trading or investing


Shorsell blo 3187
Tgt 3128
Book profit as per your risk and reward ratio
Don't wait for entire target.


TCS { 15 M Long }Nested IB at support , we are betting on upward direction here . Rest is as per charts ...
Note :-
Entry - At the break of mentioned candle's low/high
Stop Loss -
In a Short Trade, I always use Previous Candle High ( PCH ) as a stop loss while entering the trade. Sometime I might use 15 M tf SL & trade in 30M tf which I'll mention. Vice Versa for long trades
Trailing Stop Loss ( TSL ) - Mostly I trail stop loss by PCH as price falls . I exit as PCH breaks & vice versa
Use of PSAR as TSL :- TSL get's hit in trend following due to noise, In such cases I use PSAR to be in trend & exit if PSAR direction change
You can use any one of above mentioned or your own way to manage risk
Time Frame :- I take ~ 90% of my intraday trades in 15m tf. Where my analysis might come from higher frames like W , D or 1hr chart pattern which will be mentioned.
Target :- I do set target line based on support / resistance slightly above/ below it . Please pay attention to it


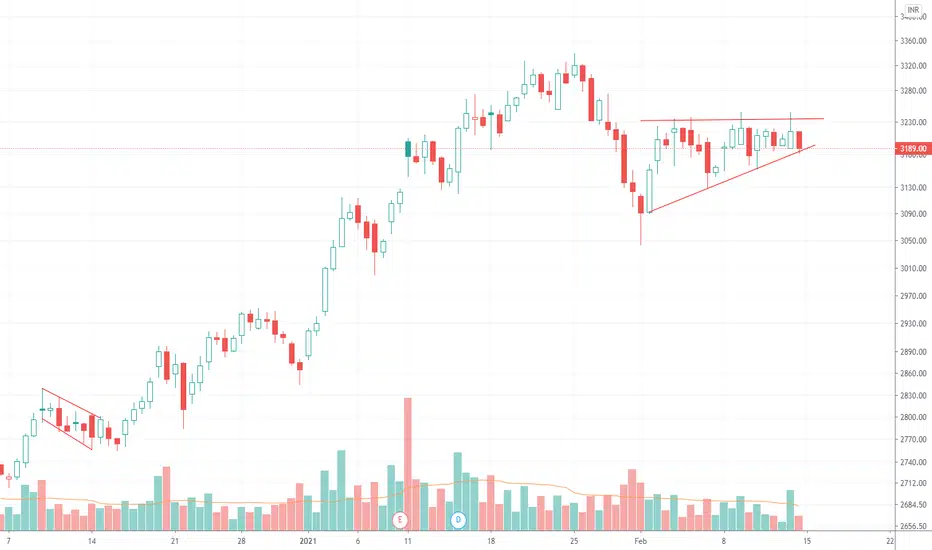
A short on TCS will make my kitty GreenA formation of M pattern breaking down the Bull Flag is seemed to be formed which can witness us to take profit at the nearest gravitational BLACK LINE


TCS - Intraday Trade SetupTCS CMP - 3176.45
Looking bearish in higher time frame. One can go for Intraday / Swing Trade setup with the following entry, exit & targets
Sell Range 3160 - 3155 ONLY / Stop Loss 3180
Target 1 - 3145
Target 2 - 3135
Target 3 - 3125
Disclaimer: This is my view and for educational purpose only.

TCS: Buy & hold for long term: India By Sun Storm Investment Research
A Profit & Solutions Strategy
Disclaimer: I am not a financial advisor, so please do your own research before trading anything

TCS { Short 30 M } As per charts
Note :-
Entry - At the break of mentioned candle's low/high
Stop Loss -
In a Short Trade, I always use Previous Candle High ( PCH ) as a stop loss while entering the trade. Sometime I might use 15 M tf SL & trade in 30M tf which I'll mention. Vice Versa for long trades
Trailing Stop Loss ( TSL ) - Mostly I trail stop loss by PCH as price falls . I exit as PCH breaks & vice versa
Use of PSAR as TSL :- TSL get's hit in trend following due to noise, In such cases I use PSAR to be in trend & exit if PSAR direction change
You can use any one of above mentioned or your own way to manage risk
Time Frame :- I take ~ 90% of my intraday trades in 15m tf. Where my analysis might come from higher frames like W , D or 1hr chart pattern which will be mentioned.
t
Target :- I do set target line based on support / resistance slightly above/ below it . Please pay attention to it


TCS: Buy & Hold: IndiaHappy New Year
By Sun Storm Investment Research
A Profit & Solutions Strategy
Disclaimer: I am not a financial advisor, so please do your own research before trading anything

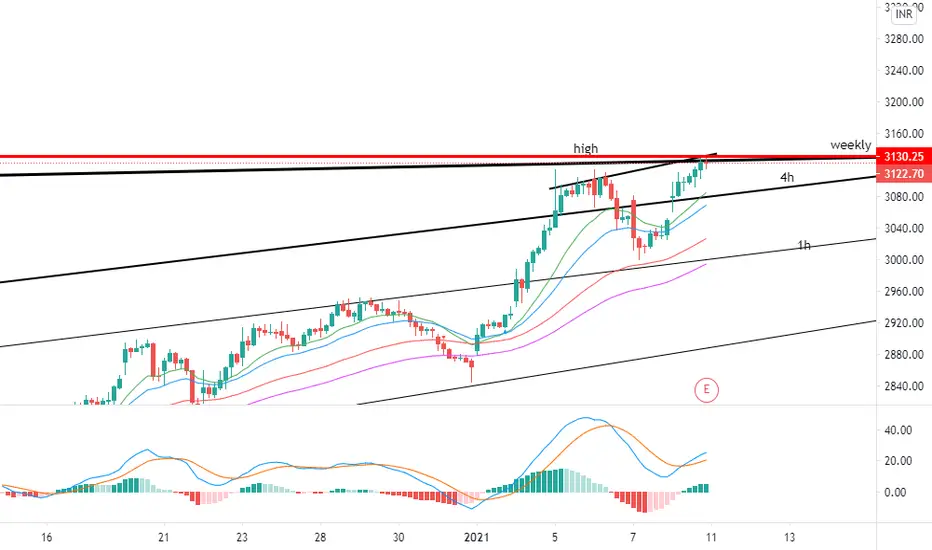
TCS - some perspectiveIT sector has been outperforming NIFTY in 2020. It seems its time for TCS to lead the IT performance in 2021

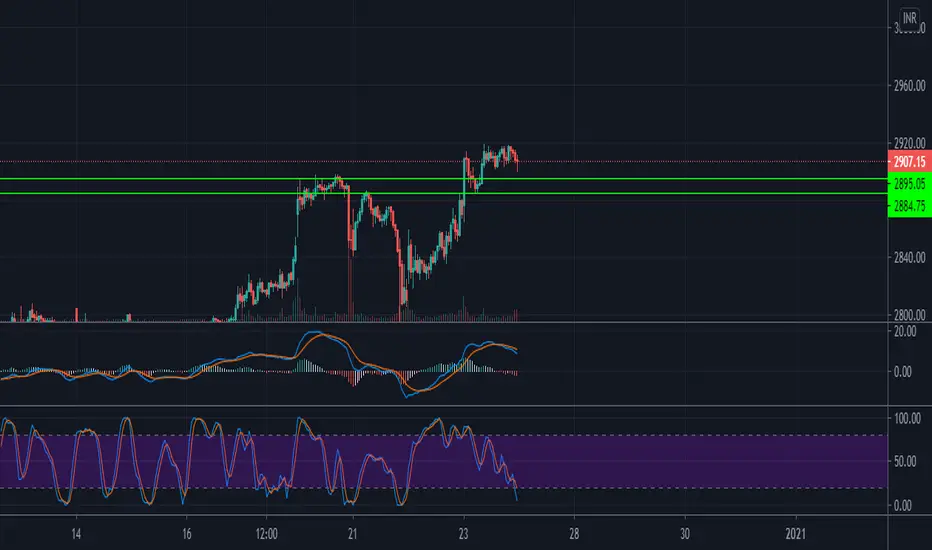
TCS Given a breakout on DAY - RESISTANCETCS given a breakout above 2887 in last to last trading session.
It tried to come down in last trading session but could not.
Hence, if it breaks last high, then BIUY position can be considered. SL - 2887.
P.S.
Follow our Telegram Channel for
1. NIFTY / BankNifty - Support / Resistance intraday Levels.
2. harmonic Reversals Stock ideas / Updates
3. Harmonic Swing Ideas / Updates

TCS Breakout on DAY _ RESISTANCETCS given a breakout above 2887 in last to last trading session.
It tried to come down in last trading session but could not.
Hence, if it breaks last high, then BIUY position can be considered. SL - 2887.
P.S.
Follow our Telegram Channel for
1. NIFTY / BankNifty - Support / Resistance intraday Levels.
2. harmonic Reversals Stock ideas / Updates
3. Harmonic Swing Ideas / Updates

tcs hy all of u guys there is two view for tomorrow.
breakout retest entry and stop loos should be ur money management