TCS moving in upward Channel.TCS is moving in upward channel. Currently the stock is at its lower bar. We can expect a bounce in prices as RSI and Stochastics both are supporting
TCS trade ideas

TCS - GO SHORT FOR A RR OF 1:3 BY MID JUNE AND 1:20 BY MID JULYTCS - GO SHORT @ 2060 WITH A SL OF 2090 AND A TARGET OF 1930 BY 16 JUNE AND A TARGET OF 1500 BY MID-JULY


TCS - 2275 NEXT I'd long this at 1998 zone may not reach the one below since the 50 day is moving up quite steeply
depending on how it opens may possibly short if it lingers around there too long for quick scalp.
slightly confused what the Nifty is up to for very short term but guess its going to keep grinding up to 10500-1070 and then range, while the other stocks continue flying.
Had a red day time for a green .....
thrill phase still in progress in the nifty so waiting on euphoria ... make sure your risk management is in place for laters..


TCS LOOKING BULLISH AS ....MONTHLY CHARTDid not really dip as bad comparatively to other stocks on the 12th of March ..was it?
anyways get excited when stocks reach their ATH and start attempting to go into price discovery .
Always a safe bet to buy on the breakout and scalp a quick 15-20 %
Let see how this plays out .. posted LTF as well.
2275 Then 2888???
raise your stop losses once in profit ..don't be lazy plan your exit before your entry :)

TCS buy only closing above 2086 else shortWeekly close above 2086 is required to move higher
else short it


TCS - TRIANGLE PATTERNIt'll break in a day or two. Below 1950 or above 2020, will bring a great movement.

Sell signal for TATA CONSULTANCY SERVICES LTD (TCS)Clear sell pressure-volume, came after several upward rejections and breaching the uptrend line.

TCS ASCENDING TRIANGLE BREAKOUT AND RISING WEDGE FORMATIONMarket analysis: Tata consultancy has broken the ascending triangle pattern structure in weekly time frame and formed a rising wedge in daily time frame. Also it has formed a double top in daily time frame. So we can wait for the market to break the neckline to start turning bearish. Can execute trades after the wedge or neckline breakout.


TCSIT pack is in momentum and TCS can lead above 2032, once it convincingly breaks 2032, you can long it for a target of 2120. View is bullish and 2032 shld be ur sl and if rises above, keep trailing the SL.

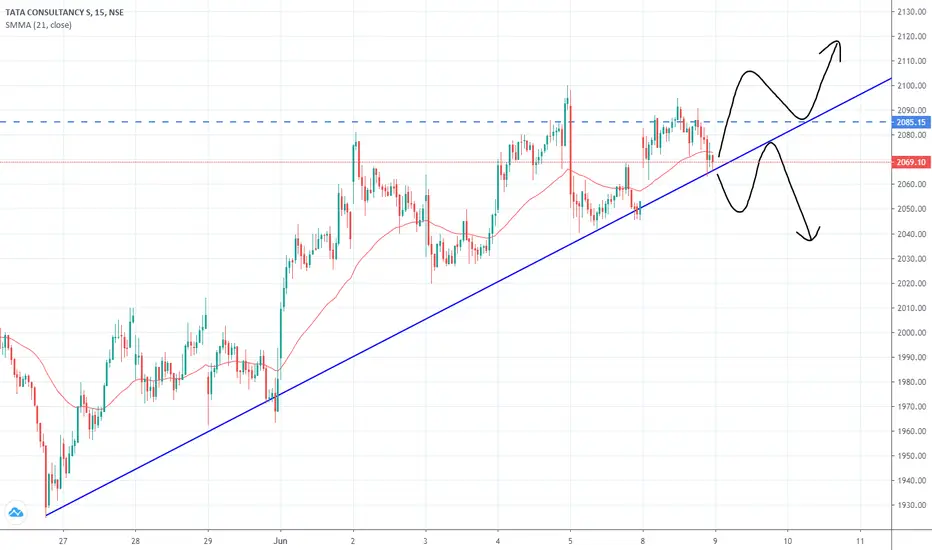
TCS Movements under ZoneBlue trendline has been acting as Support for Uptrend for weeks.
CMP: 2010
Buy Below:2k
Target seen: 2136, 2165
After that there's can be short opportunity if this trendline breaks.

TCS - GO SHORT FOR A RR OF 1:4 BY JUNE 10, 2020TCS - GO SHORT @ CMP WITH A SL OF 2146 AND A TARGET OF 1545. TARGET SHOULD BE ACHIEVED BY 15 JUNE 2020

TATA CONSULTANCY By Elliote Wave.When we Look toward TCS and drawing Elliote Wave, We will get a clear picture of the price trend.
The price is under the waves 5 Impulsive.
At 1860 You see multiple time push upside price we Can consider as good support level at 1930
"EW Trade " Target 2040-2150 for long
Thanks
