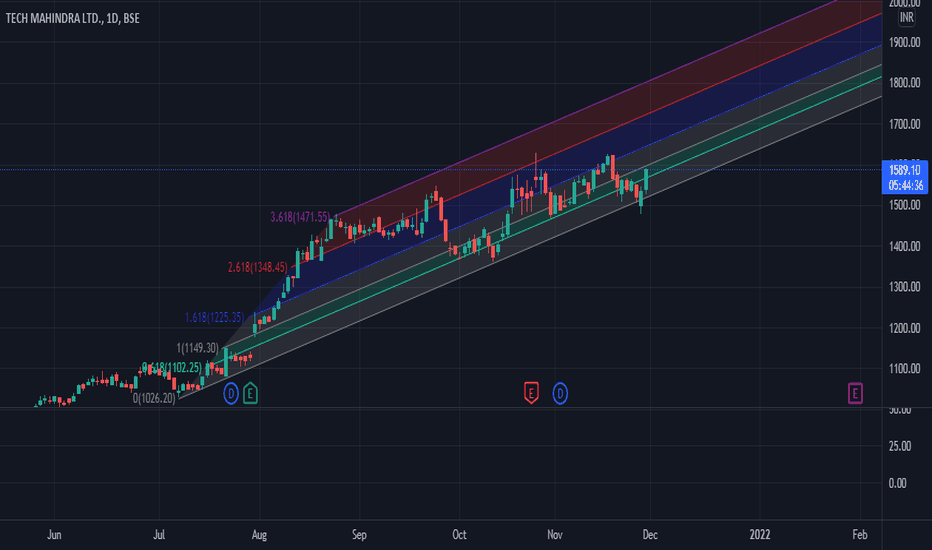
TECHM NSE TechMhindra BullishView above 1600TECHM NSE TechMhindra is Bullish if 1600 holds. New LifeTime high. Fresh Breakout. Positive Trend. ***** Educational Purpose only.Longby bubbi_cyber20040
Tech Mahindra - rectangle patternTech Mahindra..daily chart. Boundaries defined in the chart, if breakout above 1640 then may proceed towards 1800 and if closes below lower boundary 1466, then may test next support at 1364. RS positive and above price above 50 DEMA. Only for educational purposes, not buy/sell recommendation.by Saninvestor0
#Techm cash : Good sell in down market#TechM cash for 2-3 days 05.Dec 2021 Looks good sell below 1580.10 stoploss 1600 Target 1560-1563/1546 Cmp 1593.30 (Resistance 1605-1610)Shortby anandnst2
TECHMAHINDRA SEllTECH MAHINDRA SEll for day trading if IT sector also go down then we will enter in tradeShortby Mitesh_Patel_65080
TECHM looks good for upside momentumHey guys! The few last stocks I gave have all the target except ICICI bank which is still consolidating. This TECHM was bought to us on right time today by one of our member of the small group of traders and I also analysed it & it definitely looks good to me too. All the info for buying has been provided in the chart above along with the targets, this can also be done in Intraday tomorrow. BUY ABOVE: 1555 Target:1575 and above as in charts, one can also aim for ATH(all time high) RSI supporting MACD showing bears retreating Please LIKE, COMMENT and SHARE to motivate and support me. I'll keep on posting new ideas on Indices & Stocks. Be sure to follow so that you don't miss any good trades that might have been rewarding. Any comments and critiques will be appreciated even if it's of opposite view as a trader can also be right so many times.Longby this_is_shoaibUpdated 119
TCS at good levels to tradeThere is a support zone at which TCS gave breakout and made a new high. If it takes support from the zame zone then we can see a good up moveLongby hrushikeshraut631110
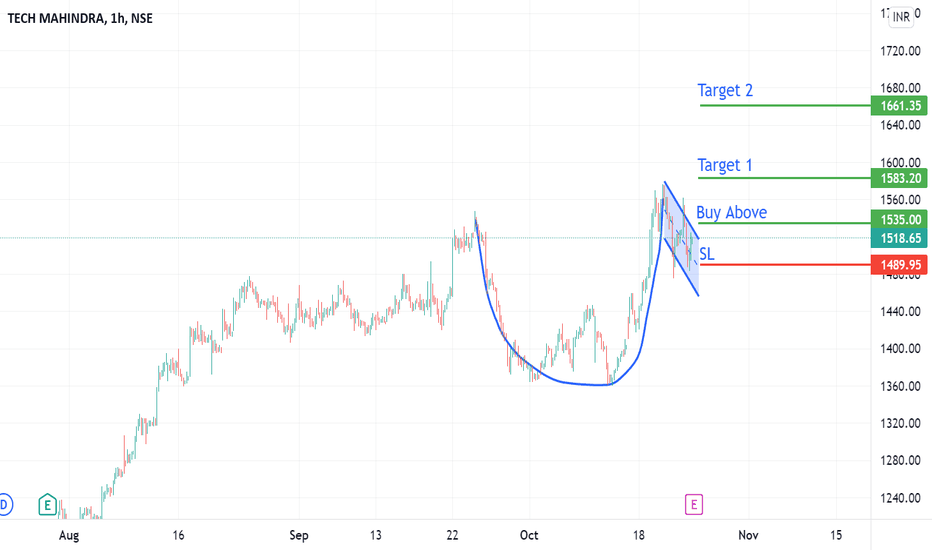
Tech Mahindra Cup and Handle Pattern Tech Mahindra forming beautiful Cup and Handle Pattern Near Lifetime High. Keep Eye on Breakout we can expect a 150-200 points target. Hit like and share Idea Happy Tradingby comfortableisprofitable3
Tech Mahindra (TECHM)Disclaimer: All Videos/Information on this channel are for Education purpose only .They are not buy/Sell Recommendations . Please consult your financial Advisor before taking any trade or investment decisions.Shortby Anonymous_2035Updated 1
Strong Resistance @ 1417-1426Based on the OI data, There is a long build up, If the resistance on the upper side is broke which is at 1417-1426, We may see 1471 levels soon which will be the next resistance.Longby rajnathr2
TECHM - RANGE BREAKOUT - WITH GOOD VOLUMETECHM - RANGE BREAKOUT - WITH GOOD VOLUME Expecting a good up move after consolidation This is for educational purpose onlyLongby WHAT_THE_STOCKUpdated 2
Tech M : Bindass long at 1521Going long with support line as Closing basis stop loss. This month stop-loss going to be wider because market is trending and supports levels are far. Please keep in mind on position size before initiating the trade.Longby nitinchidarUpdated 1
TECHM - Flag pattern breakout Chart is self explanatory. Don't invest & trade blindly.Longby Silent_Wraith224
tech m long positiontech m was consolidating on the upper side from a longtime and it breaked a very strong resistance on daily timeframeLongby ajaygothi382112
Breakout and retested twice before moving upBO from wedge like pattern and retested twice before moving up....bullish? let's wait and see...targets marked...you could think of holding it for some time at least...this is not a recommendation to buy. Longby PanchalkUpdated 1
Tech mahindra chart analysis.Tech mahindra was consolidating in a tight range from a couple of days, that led to this big move today.by parasharaditya8061
TechMahindra: Consolidating since a monthAfter 30% rally in early August, Now consolidating within a small range since 23rd August.. Once it break the upper range of consolidation, it may give 15-20% returns within a month or so.Longby MIRACLE2128114
Techm - Elliott wave analysis - 5th up expecting upside as 5th wave up after small downside below 1405, then expected a new high as 5th up before next correction Longby rJ682637460
Buy above TechmIT sector moves very positively towards upside. Techm also looks bullish, if it break previous high upside move will be very quick and nice return for swing traders. Take a chance and keep looking. Longby Ashman_subash2
TechmahindraTechmahindra on the verge of triangle & resistance breakout.. Buy above resistance & breakout level for tgts of 1500 & sloss of 1424by TORTOISE_MSUpdated 0