TECHM trade ideas

Tech mahindra breakout preparing for go beyond-900intraday-sell below 865.20 trgt-860-855 and buy-882-trgt-890.
it has made all time high breakout with high volume from the last 4month at-887 so
it can go to -920 in short term.
note-trade at your risk or watch my analysis.
plz like and comment my work.

Tech Mahindra breakout preparing for go beyond-900intraday sell below 865 trgt-860,855
and buy-882-trgt-890 it has made all time high
break out with volume at-887
last day volume is so high from the last4-5 month so it can go 920 in short term.
note-trade at own risk or watch my analysis.
plz like and comment my work.

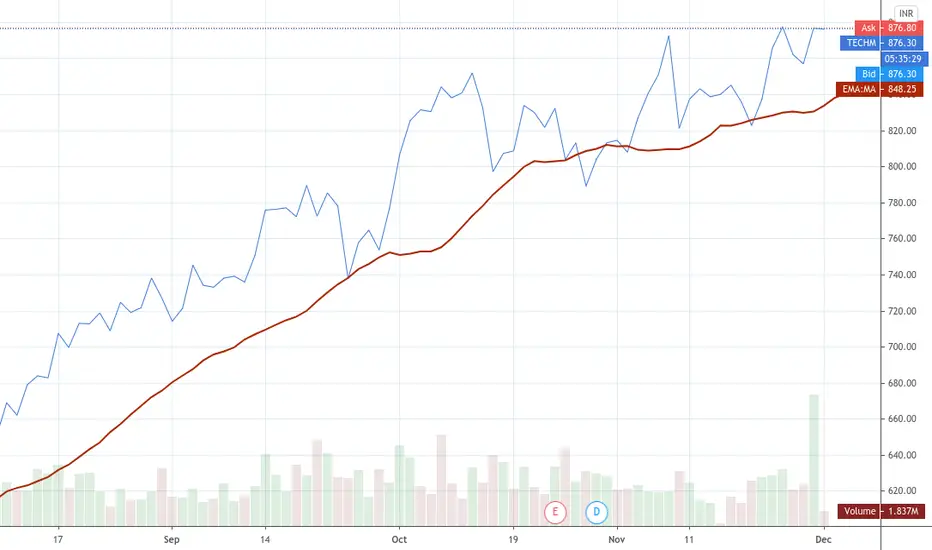
TechM_Long Call_10.50% profit in 2 monthsDate: 24 Nov 2020
TechM (CMP:882)
After a good price rise in the recent past stock was seen consolidating for a short period. During the consolidation the chart formed an Ascending Triangle Pattern. The volume can be seen increasing towards the buy side and RSI is at 62 levels. This is a good sign for buy in short - medium term.
Price Target: 965
Target date: 12 Jan 2021
T1 - 903, T2 - 934, T3 - 965; SL: 850
Profit Potential: 10% ~ 10.50%


Tech Mahindra - Break outNSE:TECHM buy with a stop loss below todays low i.e 865. Look at 940-1010 in coming days.


TECHM (Bearish H&S and Bear Flag)- Intraday/Short Term SwingThis analysis is purely based on price action and chart patterns.
The analysis is on 15min TF hence target can be achieved in intraday trade or in couple of days
Trade strategy is explained in image itself. Don't run after the price.
Always plan your trade & trade your plan
Keep trailing SL accordingly once entered into the trade. (IT sector is expected to be very volatile due to US-Elections)
Trade at your own risk and money management
Feel free to comment for any queries & suggestion

TECHM - Ascending Triangle - Short Term TradeThis analysis is purely based on price action
The analysis is on 30min TF hence target can be achieved in couple of days
Trade strategy is explained in image itself. Always plan your trade & trade your plan
Keep trailing SL accordingly once in trade
Trade at your own risk and money management
Feel free to comment for any queries & suggestion

TECHM good short candidateTECHM on weekly time frame
Bearish AB =CD pattern formation
pattern gets violated above 909 on closing basis
Down side 10-15-20% fall possible

TECHM (NSE) - Elliott wave analysis - sell set up Techm - It is possibly in (Y) wave down now. so sell with stop loss above 856 at current level with for (Y) wave down as target below 800 with small quantity. Once the price confirm the impulse down in 5 min time frame, then add more quantity on bounce of b wave, because (Y) wave will move down in abc zigzag.
Give thumbs up if you really like the trade idea.
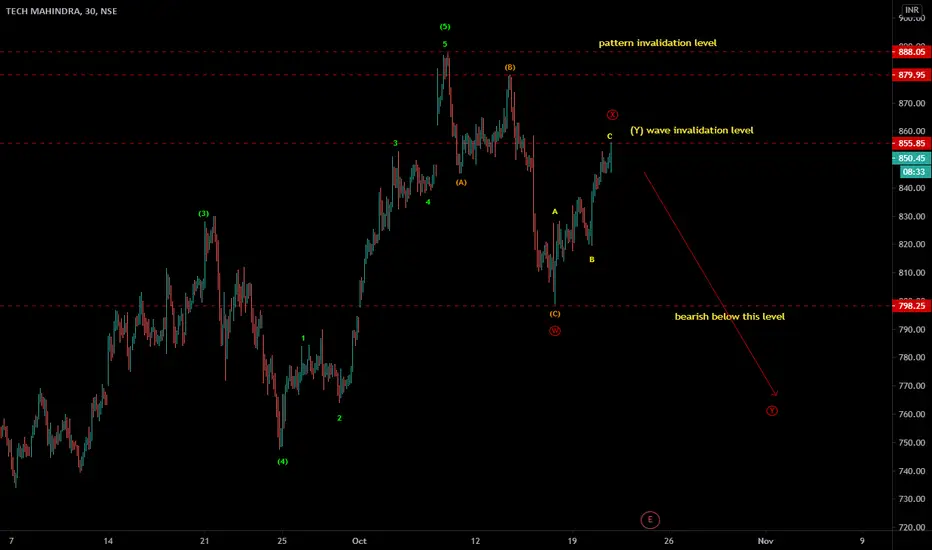

TECHM (NSE) - Elliott wave analysis TECHM (NSE) - It has completed ABC zigzag down, which was predicted earlier. The move down was designated as W wave and X wave is under progress, which may go higher. Wait for it to complete for sell set up of Y wave down. Impulse down would be the confirmation of the trade setup.
Give thumbs up if you really like the trade idea.

I'm in Tech MahindraIts a clear swing trade . A bit of back ground here
1. The top and the sharp fall were both coming. You could have gone long either on Sept 24 or on 25, and ridden it to the dotted red line. Move a bit to the left and you will find that it has acted as a pretty strong resistance .
2. Price moved beyond the strong resistance, and stayed above it for a while. I'm convinced it is not a bull trap/ fake - out ( It could be , no one is
always correct ).
3. RSI(3) gave an extremely over-bought reading and price was miles away from the MA band. A sharp fall ensued.
4. RSI(3) reaches over-sold territory, price is within the first two MAs , there is a strong long term trend, and the dotted line showed only slight resistance on the way up , and showed no absorption on the way down. I'm looking to buy.
5. I bought intra-day on Friday, when the candle was a red one with an upper tail. I was confident ( or foolish, your choice ). The reversal candle today gives me more confidence to initiate fresh longs, with a stop just below today's low.
6. You can use a risk-reward ratio for a target, or even an ATR based target. I will hold till RSI(3) reaches oversold ( or SL is hit) and then trail stops, until I find a reversal candle, or resistance. This has kept me in many moves I initially thought were only swing trades , but turned out to be huge, almost linear bull moves.
NSE:TECHM


Techm - Pennant BOTechm is at all time high resistance which was tried thrice , Seems this time it will break 845 resistance as got a huge volume and pennant breakout. Targets on chart...

3016. 858 might be a solid resistanceSL compulsory
It may even form flag breakout set up, but fib levels posses another resistance zone.

TECH MAHINDRA IN WATCHLISTExpecting a consolidation in 840 to 845.
If comes under good Risk reward then i will plan for a trade.

Investment pickNSE:TECHM
Tech Mahindra is facing resistance near 842 for past 1.5 years. Idea is to buy TECHM when it breaks out and closes above 845. This is investment idea. One can wait for Pullback also near same level after breakout. Aggressive SL: Daily closing below 798, Conservative SL: Closing below 750 on daily basis. Trade activates only after breakout.

Tech Mahindra at Good trading levelsTech Mahindra is at longterm resistance of 840-846. There's a Short opportunity with an SL above 846, which would be a Counter Trend Trade.. for trades with Bullish tendencies, one has to wait for a retracement to the Median line for a Trading opportunity.
