TECHM - W PATTERN BREAKOUT + CONSOLIDATIONTECHM
CMP 732
Long suggested ONLY above 753-755 levels.
Stop 695
Target Open
Logic:
Daily chart W pattern with volumes rising in tune with price rise and dropping during retracements.
Currently price consolidating with drop in volumes.
TECHM trade ideas


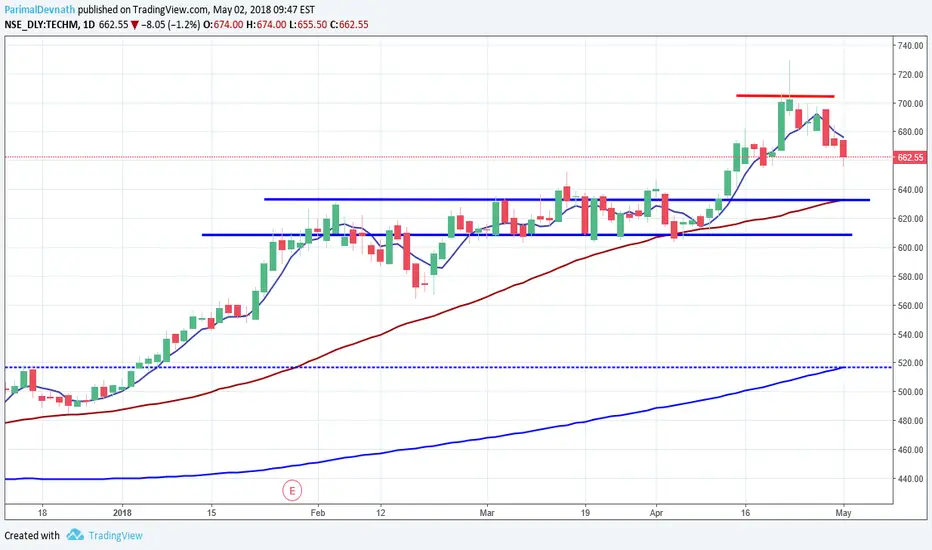
TechM, Ascending TriangleBullish stock and bullish industry segment. Price is constantly taking support at 50 DMA during correction/profit booking. An Ascending Triangle is visible. Bulls are closing in on the price in this formation of the classic pattern which means corrections are becoming smaller by day. On breakout target can be new highs beyond 755-760. SL is a must.

TechMahindra, Rounding BottomA Rounding Bottom pattern being formed. It has yet to trigger. If it triggers, target can be 50 points from here.

TechM, SupportPrice is taking support close to the breakout level. So holding the same, price can see fresh upside. This setup of long trade makes the SL quite small. Target can be the earlier high.

TechM, Breakout704 has been the tough challenge and price tried to breakout this resistance in vain. Support lines are visible. Larger trend remain up.

TchM, BreakoutThis study was posted a couple of times expecting: a) a breakout of the narrow range since the trend is bullish. Breakout has happened; b) high possibility of failure of the Shark Pattern. Pattern has failed offering bulls to rage.
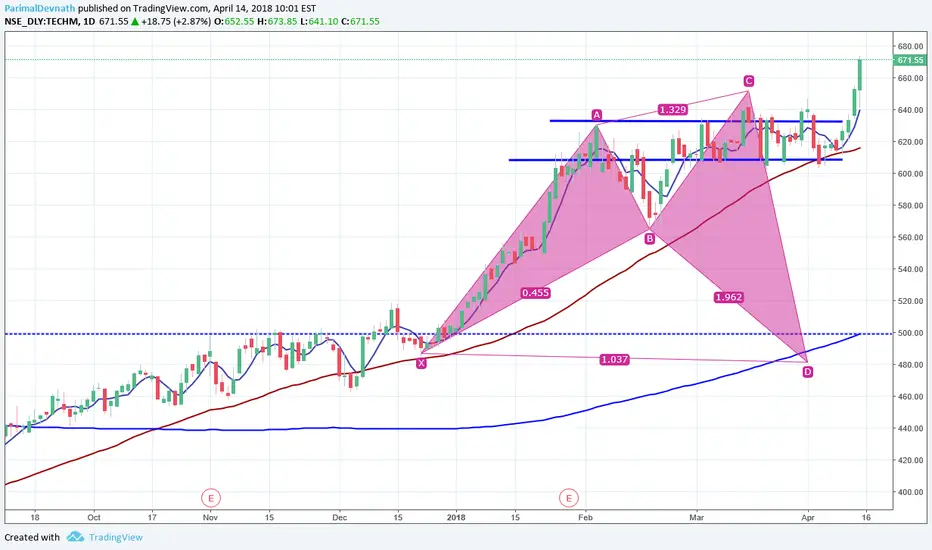
TechMThe stock is in Bulls control. Have a look at the candles. Red candles are indications of profit booking done by bulls. Then they enter long trades on small correction-- correction of just 4-5 sessions. I have drawn a probable Shark patter and the same has not been effective. This too points out to bullish stance in this counter.

Techm, SharkAs expected in the previous post, it will be difficult for the bears to play this counter. Price has not shaken despite Nifty taking beating today. Let the political weather in the capital be clear up.

TechM, Bullish SharkThough the Shark pattern looks quite perfect on parameters, yet to trade on short side at its last leg would be a bit challanging. Technicals say that 667 has bee strong resistance wherefrom price is reversing and quite strong support comes at 603.

Techm, BreakoutPrice at resistance breakout. The stock is in strong bull market. Any decline may be lapped up.

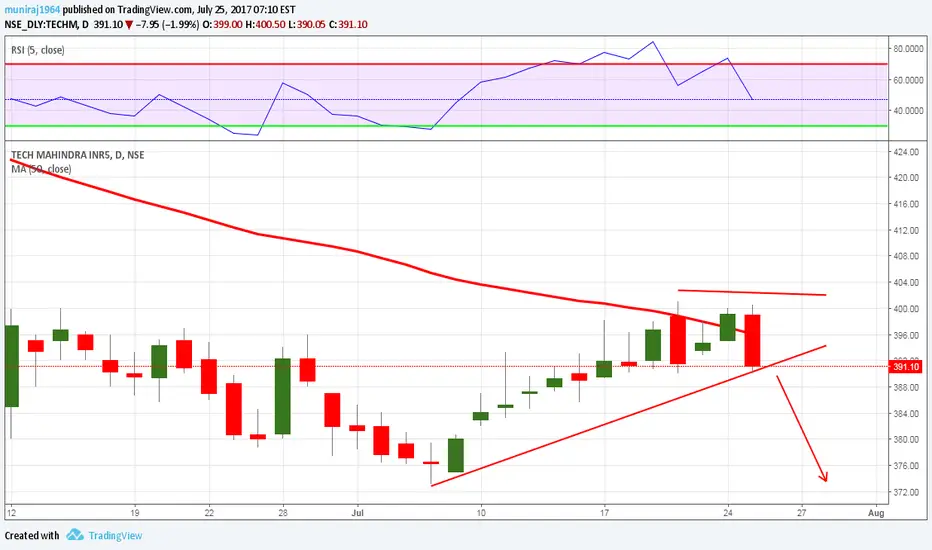
Tech Mahindra (NSE): Correction in uptrendThe long-term trend is completely intact and unchallenged. However, on the near term the outlook is a bit tiresome; bearish divergence and the lack of significant new highs suggests buyers are exhausted and a correction is around the corner. Tighten stops on existing longs or cover all together. New buying can be done if/once a deeper correction has occurred and prices set a new higher base. The area around 550<>570 would be ideal for such a base.
Primary trend: positive
Outlook: correction in uptrend, moderately negative
Strategy: cover/protect longs and re-enter after correction
Support: 571.70 / 537.50 / 506.10
Resistance: 532.10 / 665
Outlook cancelled/neutralized: n/a
NSE:TECHM


BUY Tech Mahindra TARGET 599 and above CMP 495 1 month time BUY Tech Mahindra TARGET 599 and above
CMP 495
1 month time


TechM Medium Support 440 , Long term support 410 target 515Tech M Medium support at 440 , if it falls below that then long term support at 410 , it should bounce back from here

TechM reaching support level around 440 Target 515TechM reaches support level at 440 , i feel it will be up from here

