TechMTechM is falling out of the channel ? Could this be change in the movement . Yesterday's movement is very strong.
TECHM trade ideas

TECHM - Head and Shoulder pattern All details are given on chart. If you like the analyses please do share it with your friends, like and follow me for more such interesting breakout charts.
Disc - Am not a SEBI registered. Please do your own analyses before taking position. This post is only educational purposes and not a trading recommendation.


Tech mahindraTech Mahindra daily chart have ascending triangle pattern. If this ascending triangle patter breakout upward then it will be good opportunity to go long on this stock.
Breakout level = 1103 - 1105
Target = 1290 / 1300
Stop loss = 2% below breakout level

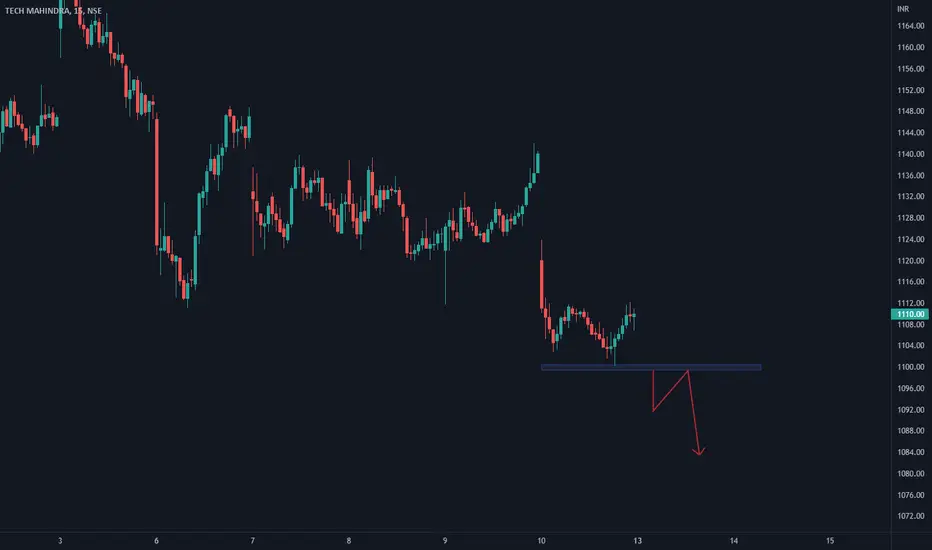
Tech Mahindra - Trade setup 23-August-2022Tech Mahindra is near the lower trend line, we can short it if it goes below 1075.
Target around: 1069.
Stop loss of 1-2 Rs.

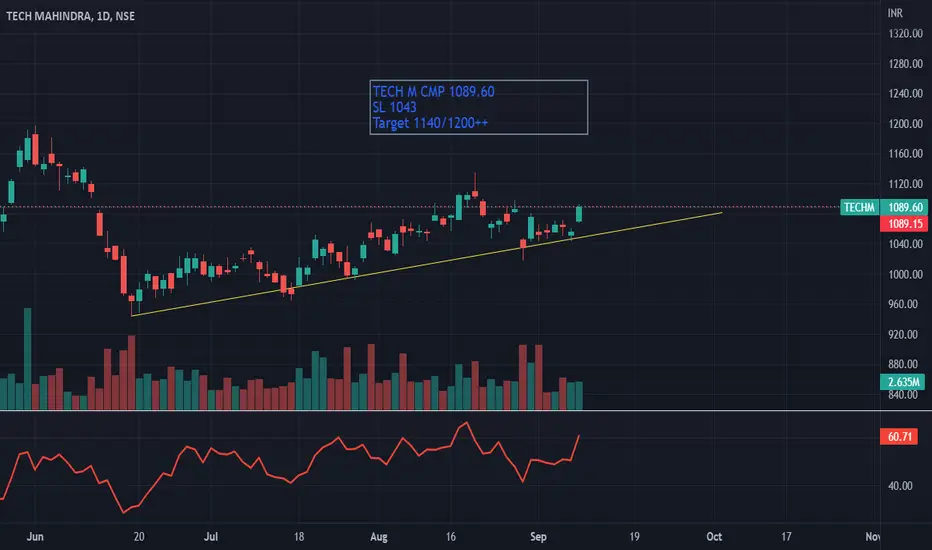
Short Idea for TECHMStock is made a down move and now pulling back to previous resistance. Pull back is very weak and candle on Friday 19th is good signal to sell. if goes opposite. i will add at 1140 . SL will be open a strong cross of 1150 will be SL


Long entry in mahindra Good trand formation wait for the break out and it's clear indicate top pull back the market reaction its best stock to invest because fundamentals is awesome my target is its ner to the 1350 to 1500

TECH MAHINDRA - NeutralTech Mahindra will be interested to watch its move in next week as it has been consolidating for long time in a short range. Today also it closed the candle above 1046 which is strong resistance. If it crosses convincingly than it may touch the TGT - 1143. Since RR is in favour after seeing next few days can be taken a position with SL - 978.

TECH MAHINDRA LEVELES ... D Candle (27.07.2022)TECH MAHINDRA now forms harmonic pattern, this junction is a good buying opportunity bcz risk reward is good, in short term we expect 1100 levels

Tech Mahendra It is stocks was faced correction in some of month
Now it is stock reversal happens and double bottom pattern show up there so this stock chances go to up side.

Tech Mahindra Trend AnalysisPrice is nearing accumulation level as per the Head & Shoulder pattern technical target.
Sound fundamentals with almost zero debt will make it soar in next bull run.
Good to accumulate around 850-920 levels for the following targets:
Short term swing target @ 1275 (43% ROI with 4.28 R:R)
Medium term swing target @ 1620 (82% ROI with 8.1 R:R)
Long term positional target @ 2200 (147% ROI with 14.5 R:R)
Stop loss @ 800
Do your own due diligence before taking any action.
Peace!!

TECH MAHINDRA - SHORT below 950, Target 800Currently Tech Mahindra is at a strong support of Fib retracement of 61.8 and round figure of 1000. There are other Fib points of confluence from 1000 to 975. So to be on a safer side, short when price closes below 950 to target 800.
Less likely scenario, alternatively, if u r already invested at high levels, hold if the price stays above 950


TechM a good buy betTechM is in a good support zone of HTF one can look for long term perspective as this is not a recommendation and tips though i have my persoal position in this stock.

Tech MahindraAt weekly timeframe, Tech Mahindra is standing at strong support around 1000 which is also a round number.
Also, 0.618 fib level, 200 EMA & POC Level present at same area.
If we look towards RSI, it's also showing techm is at oversold levels.
We can go long and add some long position in portfolio with a SL of 940.
Follow rules for profitability.
Thanks,
Sumit Thakur

Multi timeframe analysis - TECHMLet's understand multi timeframe analysis for NSE:TECHM . NSE:TECHM is closely following NSE:CNXIT .
Weekly TF -
CNXIT did a major rally after sudden fall in march 2020, made a strong base in early 2021 and then did another rally in second half of 2021. Price has been falling since January 2022 and now it has reached at a monthly/weekly/daily demand zone. Weekly RSI is also below 30 which indicates that it's heavily oversold.
TECHM chart looks very identical to CNXIT.
Daily TF -
There's a Bullish Hammer candlestick formed with a huge volume which could be a sign of trend reversal.
Price has formed bullish Bat/Alternative Bat harmonic pattern and is approaching Price Reversal Zone(D point - 925). Price could make 50% reversal from PRZ.
15 minutes/5 minutes TF -
Bullish RSI divergence has been seen on 15 minutes TF. Trendline resistance break and sustenance above it would confirm the bullish trend.
We have multiple confluences for NSE:TECHM trend reversal. Let's see how it plays out. Happy trading!

TECH MahindraTech mahindra has broken 50 EMA support in monthly time frame,
It could reach towards 100 EMA support in monthly time frame.

Tech mahindratech mahindra looking weak on weekly chart. next support area is base of accumalation zone. ie 914

TECHM sell for intraday tradingTECHM sell for intraday trading if stock and IT sector was also weak then we will short the trade....
Tech Mahindra support Hammer - BullishFundamental :
ROE > 20 %
Revenue Growth > 17 %
EBITDA > 12 %
Technical :
Hammer formed this week
SL : 1008
Target 1 : 1230
Target 2 : 1337
Target 3 : 1434
Target 4 : 1524

TECHM BOTTOMOUT-LONGAfter huge downfall expecting bounce from demand level
Purely for investment
key Levels are marked
NOTE
Am not Sebi Registered
All level marked for education purpose
