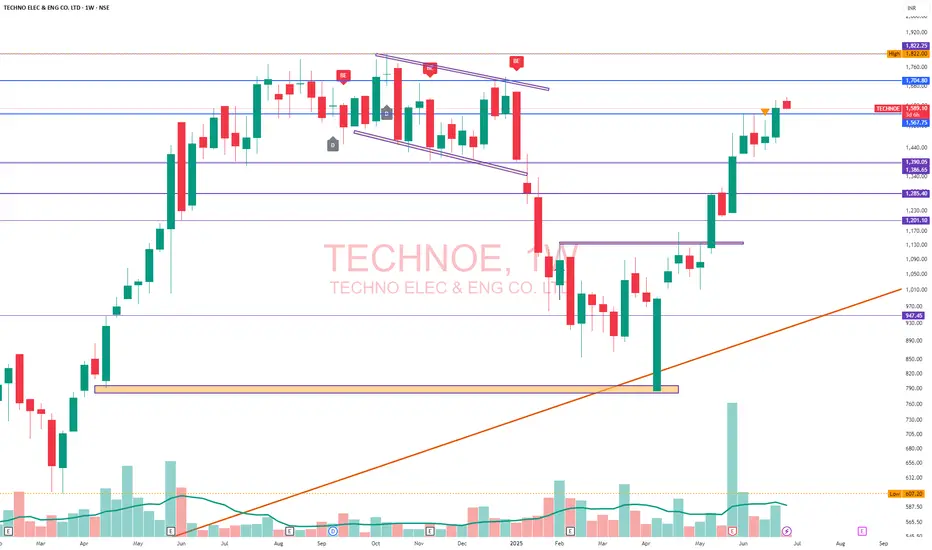
TECHNOE-1Techno Electric is looking good for swing target CMP: 1587 around.
Time: Few weeks.
Stop Loss: 1567
Target: 1600, 1650, 1700, 1750 points can be earned!
Next report date
—
Report period
—
EPS estimate
—
Revenue estimate
—
37.15 INR
4.23 B INR
22.69 B INR
49.79 M
About TECHNO ELEC & ENG CO. LTD
Sector
Industry
CEO
Padam Prakash Gupta
Website
Headquarters
Kolkata
Founded
1963
ISIN
INE285K01026
FIGI
BBG00LPFFCH1
Techno Electric & Engineering Co. Ltd. is a holding company, which engages in the provision of power generation services. It operates through the Engineering, Procurement, and Construction (EPC); and Energy segments. The company was founded in 1963 and is headquartered in Kolkata, India.
Related stocks
TECHNOETechno Electric is looking good for swing target CMP: 1517 around.
Time: Few Days.
Target: 50,100 points can be earned!

TECHNOE ANALYSISThanks for stopping by.
All analysis here is done strictly from an investor’s perspective — focusing on risk, return, valuation, and potential upside.
The notes cover key details. I’ve backed every thesis with my own analysis — no fluff, just what matters to investors.
If you find the idea useful

TECHNOE-Techno Electric & Engineering Company LtdAlmost 38% Corrected from Top Line, FII are increasing the stake QoQ and Slight decrease in DII Stake QoQ. Good New is that there is Public Holding is Less than 10%.. Follow the Stop loss and Make it Long.. Hopefully 10% upward movement shall be seen in Chart...
Keep it on radar, Soon 1200, 1250, 1


TECHNO ELEC & ENG CO. LTD S/RSupport and Resistance Levels:
Support Levels: These are price points (green line/shade) where a downward trend may be halted due to a concentration of buying interest. Imagine them as a safety net where buyers step in, preventing further decline.
Resistance Levels: Conversely, resistance levels (re

Technical Pullback seen on chartsTechnical Indicators are directing a pullback from the current lows.

50 SMA Rising - Positional TradeDisclaimer: I am not a Sebi registered adviser.
This Idea is publish purely for educational purpose only before investing in any stocks please take advise from your financial adviser.
It 50 SMA Rising. Suitable for Positional Trading Initial Stop loss lowest of last 2 candles and keep trailing with

TECHNOE is Hammering and Trapped At All Time HighTEECL, headquartered in Kolkata, is promoted by Mr P P Gupta, who is assisted by a team of professionals. It undertakes turnkey engineering, procurement and construction (EPC) projects, predominantly in the power sector, across generation, transmission, and distribution segments. In fiscal 2015, the


See all ideas
Summarizing what the indicators are suggesting.
Neutral
SellBuy
Strong sellStrong buy
Strong sellSellNeutralBuyStrong buy
Neutral
SellBuy
Strong sellStrong buy
Strong sellSellNeutralBuyStrong buy
Neutral
SellBuy
Strong sellStrong buy
Strong sellSellNeutralBuyStrong buy
An aggregate view of professional's ratings.
Neutral
SellBuy
Strong sellStrong buy
Strong sellSellNeutralBuyStrong buy
Neutral
SellBuy
Strong sellStrong buy
Strong sellSellNeutralBuyStrong buy
Neutral
SellBuy
Strong sellStrong buy
Strong sellSellNeutralBuyStrong buy
Displays a symbol's price movements over previous years to identify recurring trends.
Frequently Asked Questions
The current price of TECHNOE is 1,419.00 INR — it has decreased by −2.56% in the past 24 hours. Watch TECHNO ELEC & ENG CO. LTD stock price performance more closely on the chart.
Depending on the exchange, the stock ticker may vary. For instance, on NSE exchange TECHNO ELEC & ENG CO. LTD stocks are traded under the ticker TECHNOE.
TECHNOE stock has fallen by −3.76% compared to the previous week, the month change is a −13.21% fall, over the last year TECHNO ELEC & ENG CO. LTD has showed a −16.28% decrease.
We've gathered analysts' opinions on TECHNO ELEC & ENG CO. LTD future price: according to them, TECHNOE price has a max estimate of 1,655.00 INR and a min estimate of 1,354.00 INR. Watch TECHNOE chart and read a more detailed TECHNO ELEC & ENG CO. LTD stock forecast: see what analysts think of TECHNO ELEC & ENG CO. LTD and suggest that you do with its stocks.
TECHNOE reached its all-time high on Oct 15, 2024 with the price of 1,822.00 INR, and its all-time low was 171.05 INR and was reached on May 19, 2020. View more price dynamics on TECHNOE chart.
See other stocks reaching their highest and lowest prices.
See other stocks reaching their highest and lowest prices.
TECHNOE stock is 3.09% volatile and has beta coefficient of 1.66. Track TECHNO ELEC & ENG CO. LTD stock price on the chart and check out the list of the most volatile stocks — is TECHNO ELEC & ENG CO. LTD there?
Today TECHNO ELEC & ENG CO. LTD has the market capitalization of 164.83 B, it has decreased by −3.38% over the last week.
Yes, you can track TECHNO ELEC & ENG CO. LTD financials in yearly and quarterly reports right on TradingView.
TECHNO ELEC & ENG CO. LTD is going to release the next earnings report on Aug 19, 2025. Keep track of upcoming events with our Earnings Calendar.
TECHNOE earnings for the last quarter are 11.95 INR per share, whereas the estimation was 13.60 INR resulting in a −12.13% surprise. The estimated earnings for the next quarter are 7.10 INR per share. See more details about TECHNO ELEC & ENG CO. LTD earnings.
TECHNO ELEC & ENG CO. LTD revenue for the last quarter amounts to 8.14 B INR, despite the estimated figure of 8.68 B INR. In the next quarter, revenue is expected to reach 6.10 B INR.
TECHNOE net income for the last quarter is 1.35 B INR, while the quarter before that showed 959.90 M INR of net income which accounts for 40.27% change. Track more TECHNO ELEC & ENG CO. LTD financial stats to get the full picture.
Yes, TECHNOE dividends are paid annually. The last dividend per share was 7.00 INR. As of today, Dividend Yield (TTM)% is 0.49%. Tracking TECHNO ELEC & ENG CO. LTD dividends might help you take more informed decisions.
EBITDA measures a company's operating performance, its growth signifies an improvement in the efficiency of a company. TECHNO ELEC & ENG CO. LTD EBITDA is 3.39 B INR, and current EBITDA margin is 14.95%. See more stats in TECHNO ELEC & ENG CO. LTD financial statements.
Like other stocks, TECHNOE shares are traded on stock exchanges, e.g. Nasdaq, Nyse, Euronext, and the easiest way to buy them is through an online stock broker. To do this, you need to open an account and follow a broker's procedures, then start trading. You can trade TECHNO ELEC & ENG CO. LTD stock right from TradingView charts — choose your broker and connect to your account.
Investing in stocks requires a comprehensive research: you should carefully study all the available data, e.g. company's financials, related news, and its technical analysis. So TECHNO ELEC & ENG CO. LTD technincal analysis shows the sell today, and its 1 week rating is buy. Since market conditions are prone to changes, it's worth looking a bit further into the future — according to the 1 month rating TECHNO ELEC & ENG CO. LTD stock shows the buy signal. See more of TECHNO ELEC & ENG CO. LTD technicals for a more comprehensive analysis.
If you're still not sure, try looking for inspiration in our curated watchlists.
If you're still not sure, try looking for inspiration in our curated watchlists.