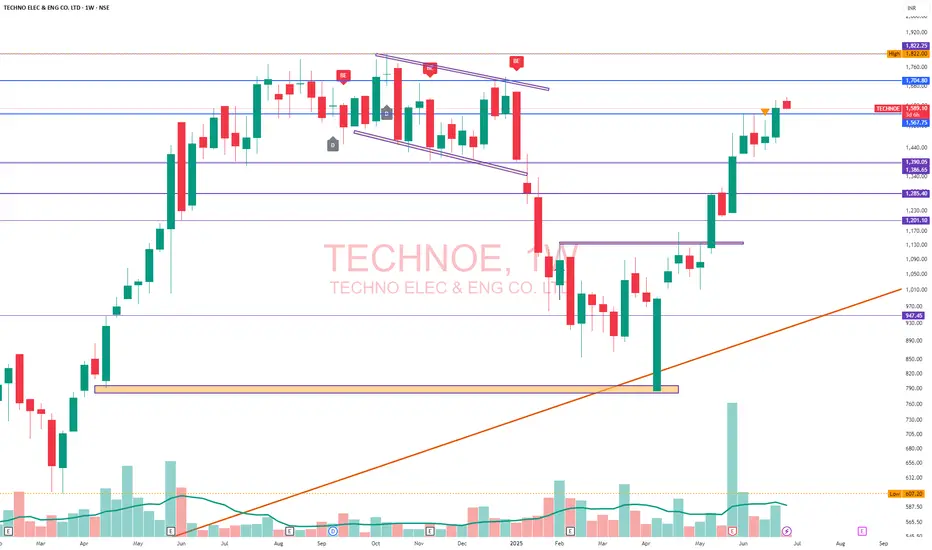
TECHNOE-1Techno Electric is looking good for swing target CMP: 1587 around.
Time: Few weeks.
Stop Loss: 1567
Target: 1600, 1650, 1700, 1750 points can be earned!
TECHNOE trade ideas
TECHNOETechno Electric is looking good for swing target CMP: 1517 around.
Time: Few Days.
Target: 50,100 points can be earned!

TECHNOE ANALYSISThanks for stopping by.
All analysis here is done strictly from an investor’s perspective — focusing on risk, return, valuation, and potential upside.
The notes cover key details. I’ve backed every thesis with my own analysis — no fluff, just what matters to investors.
If you find the idea useful or have suggestions, feel free to leave a comment. Always open to fresh insights.
Kind regards,
Psycho Trader

TECHNOE-Techno Electric & Engineering Company LtdAlmost 38% Corrected from Top Line, FII are increasing the stake QoQ and Slight decrease in DII Stake QoQ. Good New is that there is Public Holding is Less than 10%.. Follow the Stop loss and Make it Long.. Hopefully 10% upward movement shall be seen in Chart...
Keep it on radar, Soon 1200, 1250, 1300, 1350...


TECHNO ELEC & ENG CO. LTD S/RSupport and Resistance Levels:
Support Levels: These are price points (green line/shade) where a downward trend may be halted due to a concentration of buying interest. Imagine them as a safety net where buyers step in, preventing further decline.
Resistance Levels: Conversely, resistance levels (red line/shade) are where upward trends might stall due to increased selling interest. They act like a ceiling where sellers come in to push prices down.
Breakouts:
Bullish Breakout: When the price moves above resistance, it often indicates strong buying interest and the potential for a continued uptrend. Traders may view this as a signal to buy or hold.
Bearish Breakout: When the price falls below support, it can signal strong selling interest and the potential for a continued downtrend. Traders might see this as a cue to sell or avoid buying.
20 EMA (Exponential Moving Average):
Above 20 EMA(50 EMA): If the stock price is above the 20 EMA, it suggests a potential uptrend or bullish momentum.
Below 20 EMA: If the stock price is below the 20 EMA, it indicates a potential downtrend or bearish momentum.
Trendline: A trendline is a straight line drawn on a chart to represent the general direction of a data point set.
Uptrend Line: Drawn by connecting the lows in an upward trend. Indicates that the price is moving higher over time. Acts as a support level, where prices tend to bounce upward.
Downtrend Line: Drawn by connecting the highs in a downward trend. Indicates that the price is moving lower over time. It acts as a resistance level, where prices tend to drop.
RSI: RSI readings greater than the 70 level are overbought territory, and RSI readings lower than the 30 level are considered oversold territory.
Combining RSI with Support and Resistance:
Support Level: This is a price level where a stock tends to find buying interest, preventing it from falling further. If RSI is showing an oversold condition (below 30) and the price is near or at a strong support level, it could be a good buy signal.
Resistance Level: This is a price level where a stock tends to find selling interest, preventing it from rising further. If RSI is showing an overbought condition (above 70) and the price is near or at a strong resistance level, it could be a signal to sell or short the asset.
Disclaimer:
I am not a SEBI registered. The information provided here is for learning purposes only and should not be interpreted as financial advice. Consider the broader market context and consult with a qualified financial advisor before making investment decisions.

Technical Pullback seen on chartsTechnical Indicators are directing a pullback from the current lows.

50 SMA Rising - Positional TradeDisclaimer: I am not a Sebi registered adviser.
This Idea is publish purely for educational purpose only before investing in any stocks please take advise from your financial adviser.
It 50 SMA Rising. Suitable for Positional Trading Initial Stop loss lowest of last 2 candles and keep trailing with 50 days SMA if price close below 50 SMA then Exit or be in the trade some time trade can go for several months.
Be Discipline because discipline is the Key to Success in the STOCK Market.
Trade What you see not what you Think

TECHNOE is Hammering and Trapped At All Time HighTEECL, headquartered in Kolkata, is promoted by Mr P P Gupta, who is assisted by a team of professionals. It undertakes turnkey engineering, procurement and construction (EPC) projects, predominantly in the power sector, across generation, transmission, and distribution segments. In fiscal 2015, the company received the Best Safety Award from Power Grid. TEECL entered the renewable power generation space in 2009 with 45 megawatt (MW) of wind energy assets by acquiring Super Wind. It acquired Simran Wind Project Ltd (Simran) in 2009, which had installed capacity of 50.45 MW that was subsequently scaled up to 162.35 MW. The company divested 44.45 MW and 33 MW of capacity of Simran in May 2015 and January 2017, respectively. TEECL got its current name post its merger with Simran.
For the nine months through December 2023 profit after tax (PAT) was Rs 200 crore over total income of Rs 1198 crore compared with Rs 126 crore and Rs 516 crore, respectively, in the corresponding period the previous year.
Current
Order Book is
Rs 1600 Crores
Techno is targeting for
Rs 2000 - 2500 crores
every year in its segment
Techno envisages to develop
250 MW of Data Centers with
a capex of over USD 1.3 billion
in the next 5-6 years
As per, Gazette notification (GOI) all Thermal Power Plants
need to limit their sulphur emission.
Total Target is for 211.52 GW (67.25 GW by Central Govt.,
67.74 GW by State Govt. and 76.528 GW by private players)
by 2026.
Of these, around 10.6 GW is already installed, and bids for
102.96 GW are already awarded.
Bids for 23.67 GW has been opened
Around 71.42 GW are around various stages before being
awarded.
They have received the contract for 500 MW from DVC for Rs
3190 million (already commissioned) and an order worth Rs
14550 million from Rajasthan Rajya Vidyut Nigam Ltd.
They have tenders worth Rs 1000 crores under bidding in the
pipeline
Govt. of India plans to grow from 1 mn smart meters to 250 mn smart meters
Till now total smart meters sanctioned for installation is 229.8 mn
Out of the above, around 8.64 mn meters have been installed till now, and rest are
under various stages of implementation.
Currently, most of the orders getting bided are on the RDSS Scheme (87.71% of the
sanctioned meters)
Techno has received orders for 3.77 lakh meters at Jammu & Kashmir
Techno has also got an order worth Rs 633.23 crores for 5.53 lakh smart meters at
Indore and J&K for 7.25 lakh meters worth 1041 crores under the DBFOOT model.
Techno is bidding for various projects for 40 Lakh meter projects worth Rs 4500
crores.


TECHNOENSE:TECHNOE
One Can Enter Now ! Or Wait for Retest of the Trendline (BO) Or wait For better R:R ratio
Note :
1.One Can Go long with a Strict SL below the Trendline or Swing Low of Daily Candle.
2. Close, should be good and Clean.
3. R:R ratio should be 1 :2 minimum
4. Plan as per your RISK appetite
Disclaimer : You are responsible for your Profits and loss, Shared for Educational purpose
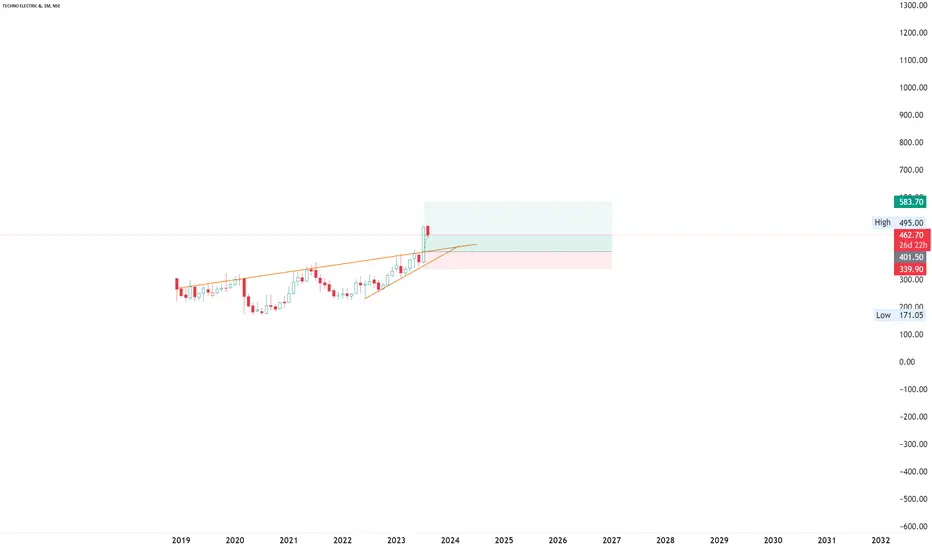
Wedge Pattern Breakout - TECHNOEPlease look into the chart for a detailed understanding.
Consider these for short-term & swing trades with 2% profit.
For BTST trades consider booking
target for 1% - 2%
For long-term trades look out for resistance drawn above closing.
Please consider these ideas for educational purpose


TECHNOE | Opportunity to earn 20%+ in Swing Trade !Opportunity to earn 20%+ in short term trade.
CMP: 242.50 (enter @ 245.80)
SL: 237
Target: 259.55 | 268.5 | 283.20
( Targets calculated on the basis of Fib. and previous swings)
Disclaimer:
I am not a SEBI registered analyst. My studies are for educational purposes only. Please consult your financial advisor before trading or investing. I am here just to share my views and have fun!!! Don’t take me seriously…..
Happy trading !!!

TECHNOE..1DNSE:TECHNOE
Please note that we are not a SEBI Registered Investor Adviser/PMS/ Broking House.
All the contents over here are for educational purposes only and are not investment advice or recommendations
offered to any person(s) with respect to the purchase or sale of the stocks / futures and options.
You are also requested to apply your prudence and consult your advisers in case you choose to act on
any such content available as WE claims no responsibilities for any of your actions or any outcome of
such action

TECHNOE ::: BULLISH :::DATE: 24 JUL 2021
INSTRUMENT: TECHNOE
TREND: BUY
TIME FRAME: DAY
CMP: 310.75
BUY ABOVE: 317
STOP LOSS: 295
TGT 01: 330
TGT 02: 346
INDICATORS USED:
PARABOLIC SAR: BELLOW CANDLE- BULLISH
STOCH: BULLISH
RISK DISCLOSURE:
We are not S E B I registered analysts. VIEWS EXPRESSED HERE ARE FOR OUR RECORD PURPOSES ONLY. Please consult your personal financial advisor before investing. We are not responsible for your profits/losses whatsoever.

TECHNO ELECTRIC Positional tradeNSE:TECHNOE Levels are Mentioned in the chart... Look for Swing...
Note:
1. Views are personal. Recheck and take the trade as per your RR.
2. Always remember SL is your lifeline not the big target...
3.Follow us for more patterns and like, share so that we feel it is helpful to many and share more patterns...
3. Views given here is not a tip rather it is for educational purpose... After market opens, the condition might change so learn to handle for different conditions..
4. To learn more about patterns, Psychology behind the trade and price action trading... contact us.. Thanks..

