**Tega Industries – Breakout Setup (Cup with Handle Pattern)****Tega Industries – Breakout Setup (Cup with Handle Pattern)**
**Chart Pattern Identified**:
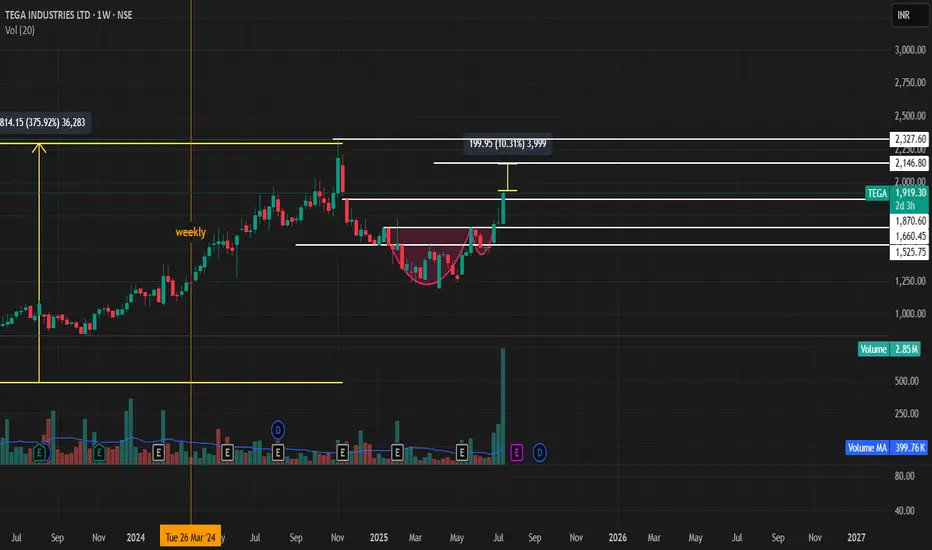
A **Cup with Handle** formation has been identified on the daily/weekly chart of **Tega Industries**, signaling a potential bullish breakout. This classic continuation pattern typically leads to strong upward moves once the handle breakout is confirmed.
---
### 🔍 **Breakout Levels and Price Targets**
1. **Primary Breakout Level – ₹1660**
* This marks the neckline of the **Cup with Handle** formation.
* A confirmed breakout and tgt ₹2,145 would validate the pattern.
(based on the measured move from the depth of the cup added to the breakout point)
2. **Secondary Breakout Level – ₹1,875**
* Acts as a **pre-breakout resistance** or consolidation level.
* A **daily or weekly close above ₹1,875** with strong volume would indicate early momentum and buyer interest.
* **Target after this level is breached**: ₹2,145 (primary breakout zone), and if sustained, an extended target of **₹2,530**.
---
### 📌 **Technical Outlook**
| Level | Significance | Action |
| ------ | ------------------------ | --------------------------------------------------- |
| ₹1,875 | Secondary breakout level | Watch for strong close with volume; bullish trigger |
| ₹1660 | Cup with handle breakout | Key confirmation zone; breakout of pattern |
| ₹2,530 | Extended target | Projected move after full breakout confirmation |
---
### 📈 **Trade Strategy**
* **Entry Option 1**: Anticipatory buy near ₹1,875.
* **Entry Option 2**: Breakout confirmation buy above ₹1875 with higher risk-reward toward ₹2,530.
* **Volume Confirmation**: Essential at both ₹1660 and ₹1875 levels.
* **Stop-loss**: Dynamic trailing stop-loss below handle lows or breakout support zones depending on entry.
---
### ⚠️ **Risk Management & Considerations**
* Ensure confirmation via **volume expansion** and **daily/weekly close** above key breakout zones.
* Be cautious of false breakouts, especially if moves happen on low volume or during broader market weakness.
* Monitor sectoral momentum (capital goods, engineering, or mining equipment) as it may influence breakout strength.
---
Would you like me to generate a chart snapshot or help you set up price alerts or trading logic based on this setup?
TEGA trade ideas
TEGA INDUSTRIES LTD S/RSupport and Resistance Levels:
Support Levels: These are price points (green line/shade) where a downward trend may be halted due to a concentration of buying interest. Imagine them as a safety net where buyers step in, preventing further decline.
Resistance Levels: Conversely, resistance levels (red line/shade) are where upward trends might stall due to increased selling interest. They act like a ceiling where sellers come in to push prices down.
Breakouts:
Bullish Breakout: When the price moves above resistance, it often indicates strong buying interest and the potential for a continued uptrend. Traders may view this as a signal to buy or hold.
Bearish Breakout: When the price falls below support, it can signal strong selling interest and the potential for a continued downtrend. Traders might see this as a cue to sell or avoid buying.
MA Ribbon (EMA 20, EMA 50, EMA 100, EMA 200) :
Above EMA: If the stock price is above the EMA, it suggests a potential uptrend or bullish momentum.
Below EMA: If the stock price is below the EMA, it indicates a potential downtrend or bearish momentum.
Trendline: A trendline is a straight line drawn on a chart to represent the general direction of a data point set.
Uptrend Line: Drawn by connecting the lows in an upward trend. Indicates that the price is moving higher over time. Acts as a support level, where prices tend to bounce upward.
Downtrend Line: Drawn by connecting the highs in a downward trend. Indicates that the price is moving lower over time. It acts as a resistance level, where prices tend to drop.
Disclaimer:
I am not a SEBI registered. The information provided here is for learning purposes only and should not be interpreted as financial advice. Consider the broader market context and consult with a qualified financial advisor before making investment decisions.

Supply zone breakoutGood volume buildup in daily timeframe.
Cup and handle buildup in daily timeframe.
Fundamentals are good.
FII stakes are up.
NOTE: I do my analysis, do yours before trade.
Eat🍜 Sleep😴 TradingView📈 Repeat 🔁

💥Tega Industries 💥-Nice Breakout💥Tega Industries 💥-Nice Breakout
Capital to be deployed-20k
Investing Price-1530-1545
Breakout Price-1522
Stoploss-1300
Targets-2564
#tega #StocksToWatch #StocksToBuy #StocksInFocus #stocks #StockMarket

Swing trade Idea in TEGA here we can see a breakout of the cup and handle pattern of the NSE:TEGA
Tega Swing trade
CMP 1340
TP 1550
SL 1183


TEGA INDUSTRIES LTD SWING TRADE ANALYSISTEGA INDUSTRIES LTD gave weekly resistance zone breakout with gud volume bar and bullish candle on daily time frame also broke inverted head and shoulders chart pattern neck zone and closed abv inverted hammer which was near to weekly resistance zone can play for swing trade with ur RR.

Tega Industries Tega Industries
Has been looking good as the reversal signs are being seen in the lower time frames
Volumes have started coming in and more buying pressure.
DIIs have increased their stake in the last quarter
Follow the horizontal lines for trailing SL and targets
Keep this in radar!

TEGA - Bullish Swing ReversalNSE: TEGA is closing with a bullish swing reversal candle supported with volumes.
Today's volumes and candlestick formation indicates strong demand and stock should move to previous swing highs in the coming days.
The stock has been moving along the horizontal support for the past few days which is indicating demand.
One can look for a 8% to 13% gain on deployed capital in this swing trade.
The view is to be discarded in the event of the stock breaking previous swing low.
#NSEindia #Trading #StockMarketindia #Tradingview #SwingTrade

Nice Chart This Week closing looks Imp.Gratify if you appreciate the practice then you can like it, share it and
If you want me to investigate any chart for you then would cherish doing that for you.
Thank you for your time and support.
Stay safe.

TEGAIt is on all time high. we can buy on retest near 760. see price action on this level. trade with gud risk reward ratio. it may have gud return in near future.

Triangle Pattern BreakoutPlease look into the chart for a detailed understanding.
Consider these for short-term & swing trades with 2% profit.
For BTST trades consider booking
target for 1% - 2%
For long-term trades look out for resistance drawn above closing.
Please consider these ideas for educational purpose

A possible breakout in tega50DMA carry,Institutional investors increasing their holdings,supported by valuations

TEGA: Beautiful SetupTEGA Industries forming ascending triangle. Breakout will only confirm above 591. This is a low volume stock. So keep quantity Low while trading/ investing.


TEGA INDUSTRIESThe Stock has been consolidating from many trading sessions, after a move from 397 to 513 levels.
Now if it sustains 460 levels, we can see another swing on the upside towards 540 to 580 levels.

TEGA - watchTEGA may move up after cement shares prices.
wait for close above 543
small stoploss
for education purposes only

