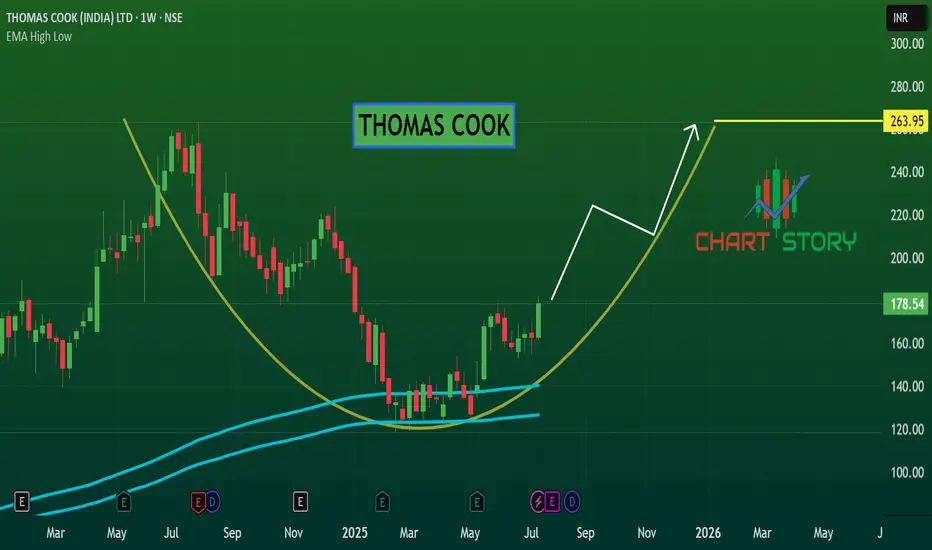
Amazing breakout on WEEKLY Timeframe - THOMASCOOKCheckout an amazing breakout happened in the stock in Weekly timeframe, macroscopically seen in Daily timeframe. Having a great favor that the stock might be bullish expecting a staggering returns of minimum 25% TGT. IMPORTANT BREAKOUT LEVELS ARE ALWAYS RESPECTED!
NOTE for learners: Place the breakout levels as per the chart shared and track it yourself to get amazed!!
#No complicated chart patterns
#No big big indicators
#No Excel sheet or number magics
TRADE IDEA: WAIT FOR THE STOCK TO BREAKOUT IN WEEKLY TIMEFRAME ABOVE THIS LEVEL.
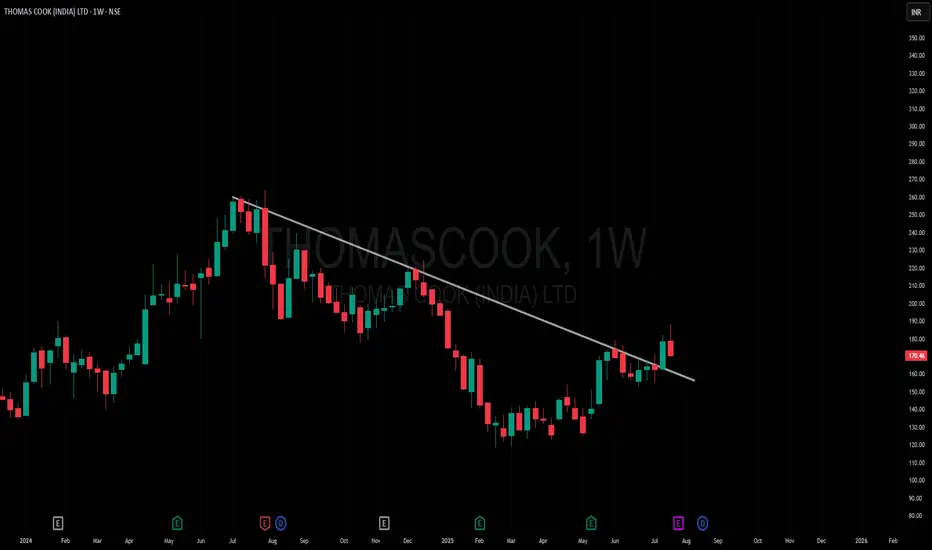
Checkout an amazing breakout happened in the stock in Weekly timeframe.
Breakouts happening in longer timeframe is way more powerful than the breakouts seen in Daily timeframe. You can blindly invest once the weekly candle closes above the breakout line and stay invested forever. Also these stocks breakouts are lifelong predictions, it means technically these breakouts happen giving more returns in the longer runs. Hence, even when the scrip makes a loss of 10% / 20% / 30% / 50%, the stock will regain and turn around. Once they again enter the same breakout level, they will flyyyyyyyyyyyy like a ROCKET if held in the portfolio in the longer run.
Time makes money, GREEDY & EGO will not make money.
Also, magically these breakouts tend to prove that the companies turn around and fundamentally becoming strong. Also the magic happens when more diversification is done in various sectors under various scripts with equal money invested in each N500 scripts.
The real deal is when to purchase and where to purchase the stock. That is where Breakout study comes into play.
Check this stock which has made an all time low and high chances that it makes a "V" shaped recovery.
> Taking support at last years support or breakout level
> High chances that it reverses from this point.
> Volume dried up badly in last few months / days.
> Very high suspicion based analysis and not based on chart patterns / candle patterns deeply.
> VALUABLE STOCK AVAILABLE AT A DISCOUNTED PRICE
> OPPURTUNITY TO ACCUMULATE ADEQUATE QUANTITY
> MARKET AFTER A CORRECTION / PANIC FALL TO MAKE GOOD INVESTMENT
DISCLAIMER : This is just for educational purpose. This type of analysis is equivalent to catching a falling knife. If you are a warrior, you throw all the knives back else you will be sorrow if it hits SL. Make sure to do your analysis well. This type of analysis only suits high risks investor and whose is willing to throw all the knives above irrespective of any sectoral rotation. BE VERY CAUTIOUS AS IT IS EXTREME BOTTOM FISHING.
HOWEVER, THIS IS HOW MULTIBAGGERS ARE CAUGHT !
STOCK IS AT RIGHT PE / RIGHT EVALUATION / MORE ROAD TO GROW / CORRECTED IV / EXCELLENT BOOKS / USING MARKET CRASH AS AN OPPURTUNITY / EPS AT SKY.
LET'S PUMP IN SOME MONEY AND REVOLUTIONIZE THE NATION'S ECONOMY!
THOMASCOOK trade ideas
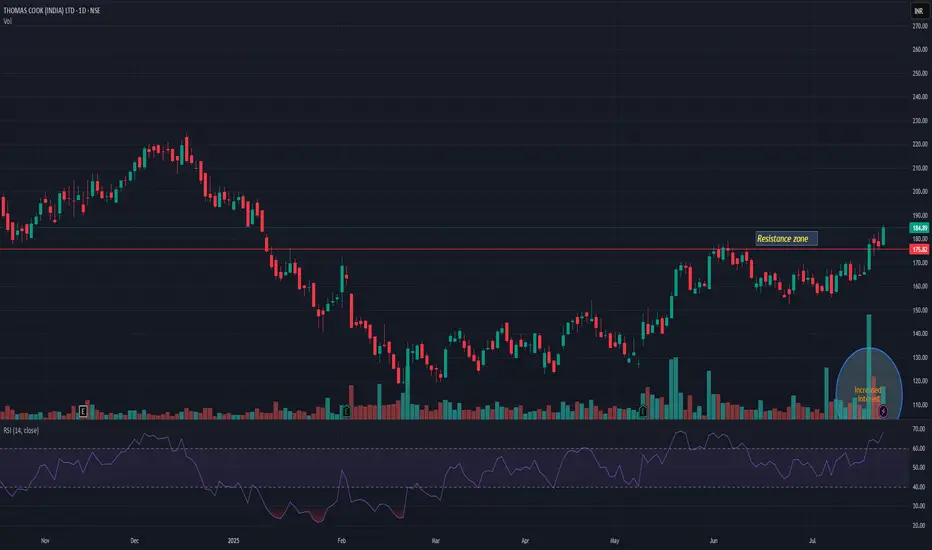
THOMASCOOKTHOMASCOOK has broken previous resistance level. Market participation is also increased with breakout. It may resist nr 210-12 level. Closing below 175 may change my view. Keep it on radar.
THOMAS COOK - BOTTOM FISHINGNSE:THOMASCOOK Weekly rounding bottom with momentum and macd crossover may continue upward with same momentum.
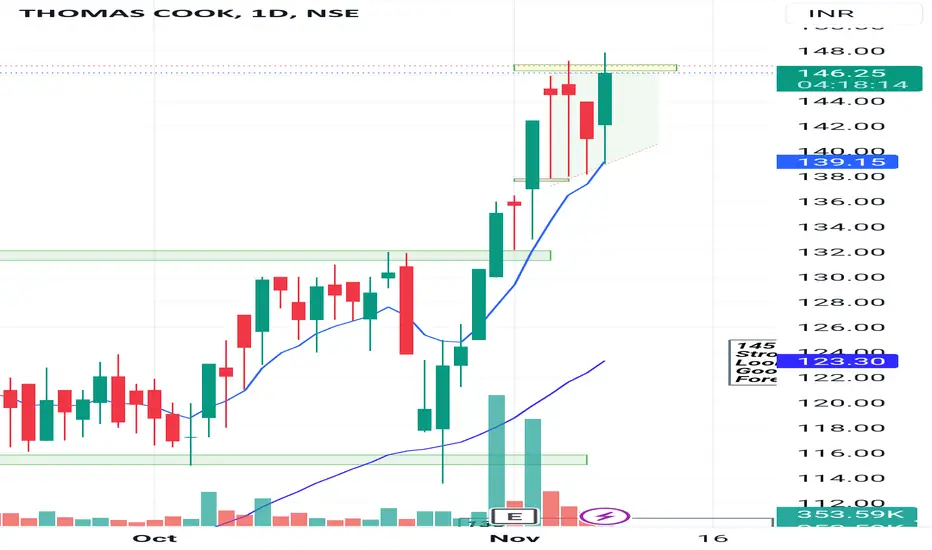
Cup and Handle Breakout in THOMAS COOK (INDIA) LTDTHOMAS COOK (INDIA) LTD is showing a classic Cup and Handle breakout pattern on the daily chart.
🔍 Chart Highlight
Breakout from the Cup's rim around ₹169.93 level.
Strong bullish candle with +7.61% gain, backed by higher volume.
Price sustained above the 200 EMA (₹163.85).
Next potential resistance: ₹197.29, a previous swing high.
Levels to Watch:
Support Zone: ₹163.85 – ₹169.93 (200 EMA + breakout retest zone)
Resistance Zone: ₹197.29 (next swing high)
If the price retests and holds above ₹169.93, it could offer a good risk-reward opportunity with ₹197+ as the near-term target. Keep an eye on volume and any pullback toward the breakout zone.
⚠️ Disclaimer:
This idea is for educational purposes only and not financial advice. Please do your own research or consult your financial advisor before making any trading decisions. Markets carry risk — trade wisely!

#THOMASCOOK is near to Break Previous All Time High
Company has reduced debt.
Company is expected to give good quarter
Company's median sales growth is 43.8% of last 10 years

THOMAS COOK ( Whats Cooking ? )Thomas Cook Seems to cross its long term trendline Resistance on a Monthly chart
Will be interesting to see how the Monthly candle closes at the end of May 2024
* FII have raised its holding in this stock
* PAT and NET PROFIT have grown substantially
A good TechnoFunda bet

Trade Idea in THOMASCOOKHere we can see a Swing Trade in NSE:THOMASCOOK
Buy NSE:THOMASCOOK
CMP 192
TP 122
SL 169
Thomas Cook (India) Ltd. is a holding company, which engages in the provision of travel and travel related financial services. It offers foreign exchange, corporate travel, MICE, leisure travel, insurance, visa and passport services, and e-business. It operates through the following business segments: Financial Services, Travel and Related Services, Leisure Hospitality and Resorts Business, and Digiphoto Imaging Services. The Financial Services segment includes wholesale purchase and sale of foreign currencies and paid documents. The Travel and Related Services segment covers the operations, travel management, visa services, travel insurance, and related servicesThe Leisure Hospitality and Resorts Business segment relates to the time share holidays' business. The Digiphoto Imaging Services segment focuses on imaging solutions and related services. The company was founded in 1881 and is headquartered in Mumbai, India.

Thomas Cook Long PositionBuy Thomas Cook @ CMP
for the Target of 212-363
SL 120
Strategy : SBO + RSI > 60 + EMA above 20 & 50
Duration few Weeks

Thomas cook on a Ascending triangleTechnically in a good position
Made an ascending traingle
Waiting for a big break
Afrer a short term dip selling pressure
Reduced and buyers stepped in.
Turnaround story..
Travel Business is rcovering and growing on a good pace is positive factors.
165 next target
Stop140.
Risky bet..

THOMASCOOK 21 Month Consolidation - 52 Week ZoneThomas Cook (India) Ltd
NSE: THOMASCOOK
Formed a massive 21 month Range bound price compression and is near 52 week high zone.
Volume popup's visible.
About to give a breakout.
Prior Uptrend forms a bullish flag pattern in play.

Triangle Pattern BreakoutPlease look into the chart for a detailed understanding.
Consider these for short-term & swing trades with 2% profit.
For BTST trades consider booking
target for 1% - 2%
For long-term trades look out for resistance drawn above closing.
Please consider these ideas for educational purpose

Thomas Cook India Ltd - Double Digit + MACD Crossover 📊 Script: THOMASCOOK (THOMAS COOK (INDIA) LIMITED)
📊 Nifty50 Stock: NO
📊 Sectoral Index: NIFTY 500
📊 Sector: Consumer Services
📊 Industry: Tour Travel Related Services
Key highlights: 💡⚡
📈 Script is trading at upper band of Bollinger Bands (BB) and giving breakout of it.
📈 MACD is giving crossover.
📈 Double Moving Averages may give crossover in next trading session.
📈 Volume is increasing along with price which is volume breakout.
📈 Current RSI is around 67.
📈 One can go for Swing Trade.
⏱️ C.M.P 📑💰- 81
🟢 Target 🎯🏆 - 91
⚠️ Stoploss ☠️🚫 - 75
⚠️ Important: Always maintain your Risk & Reward Ratio.
⚠️ Purely technical based pick.
✅Like and follow to never miss a new idea!✅
Disclaimer: I am not SEBI Registered Advisor. My posts are purely for training and educational purposes.
Eat🍜 Sleep😴 TradingView📈 Repeat🔁
Happy learning with trading. Cheers!🥂

Thomas Cook for swing trading Thomas Cook formed Cup and handle pattern it will give breakout soon you can take trade for 1½weeks RR 1:1
Trade responsibaly you are the one responsible for loss and gain


BUY CMP 51.5Stop Loss 47
Target 53 - 55 - 58 - 60-65-70
With Corona vaccination started and also summer comming, travel will be big.
Poistional Trade


Thomascook Long NovemberThomas cook long above 28 sl 24
TGT open
Can be kept as an investment for long term

#Thomascook patiencebuy if support holds or breakout from the triangle
Always #DYOR
I AM NOT FINACIAL ADVISOR 🖖 🖖 🖖 🖖

THOMASCOOK LONG --> Target 148.5 (Short Term)In 4 hour chart, NSE:THOMASCOOK is having a potential short term buy trade.

Accumalate or neutral zone in Thomas CookAs can be seen the price is taking support in the cloud. Currently is in accumulate zone as seen from previous entries in the cloud zone and the way it has always been a support for the price. Look to enter after this week candle formation and next week price action to confirm whether to accumulate or look for exiting the issue once price closes decisively below the cloud.
