TITAN TRENDLINE BREAKED UPTITAN TREND LINE BREAKED UP IT FACING RESISTANCE 1459 LEVEL ONCE IT BREAKED UP IT GO UP,ITS ONLY EDUCATION PURPOSE ONLY.IT ALSO TAKING 20 MOVING AVERAGE SUPPORT.
TITAN trade ideas


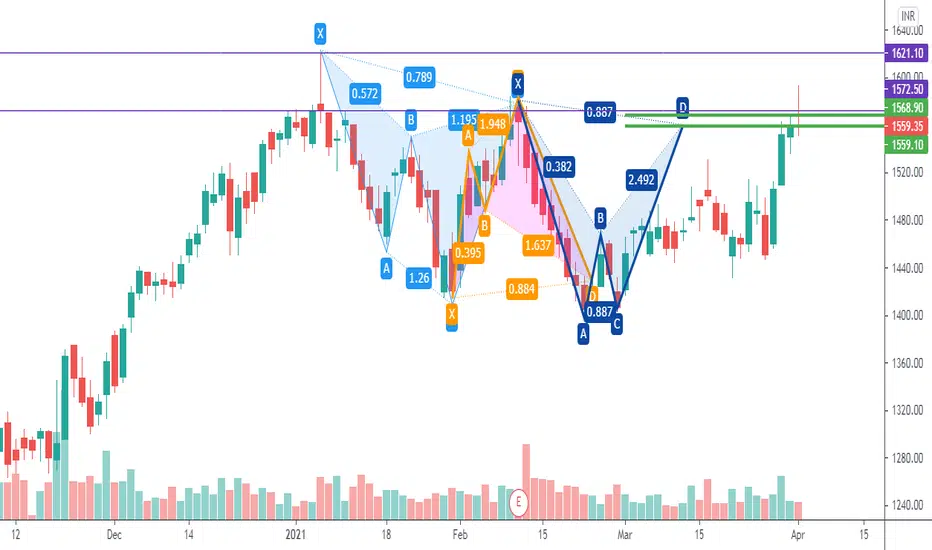
Titan trend analysis. Support and RNSE:TITAN
#Titan is slightly sideways to downtrend closing below 1335 is start of downfall for long term till 1150 or more.


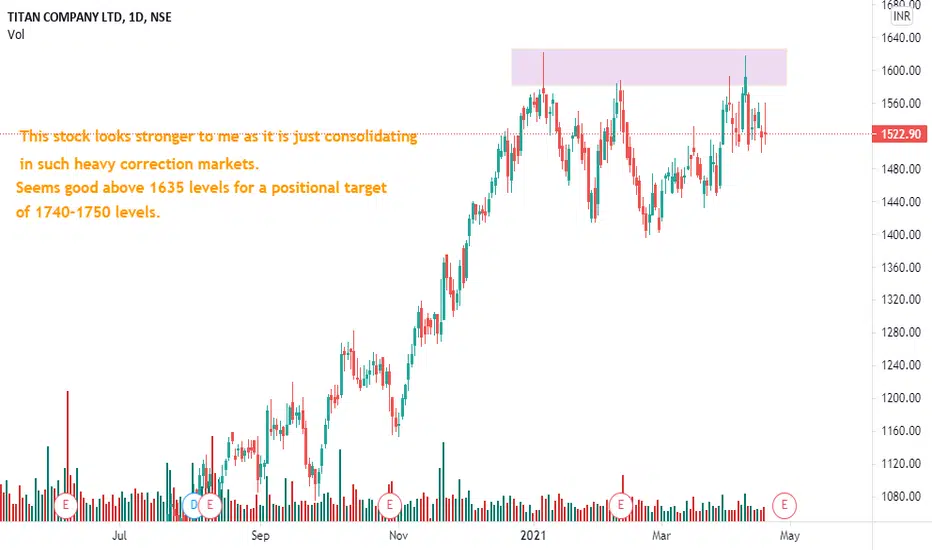
Range bound sell below 1400it has been in a range and currently very close to lower end of the range. sell below 1400. or buy above 1600

TITAN - ascending triangle pattern - longTitan is forming ascending triangle pattern. Now almost at the lower trendline level.
2 options:
1. If takes support on trendline or around 1440, make an entry for target 1570. SL below 1400 closing. Keep tracking nifty if it doesn't support we might get SL here.
2. best scenario will be above 1600 closing, it'll give a breakout which can take it to at least 100-200 points up. Targets - 1800, 1900, 2000. Use lower trendline or 1540 as SL. Breakout and retesting the 1600 level will be the best scenario for this trade.

support and resistance stratergyreasons to short:-
1) head and shoulder retest.
2) down trend line resistance
3) strong uptrend break and retest .


Titan - Intraday Trade SetupTitan CMP - 1480.85 *High Probability*
Looking bearish in higher time frame. One can go for Intraday Trade Setup with the following entry, exit & targets.
Sell At or Below 1472 / Stop Loss 1485
Target 1 - 1465
Target 2 - 1460
Target 3 - 1455
Disclaimer: This is my view and for educational purpose only.

Flag Pattern Channel BreakoutStock Analysis: Titan has broken Flag Channel trading on demand zone as long as it is not breaking below demand zone expecting the short term target given on the chart.
Happy Investing!

Titan Will start Downtrend From Now On Huge rejection at the top
See huge selling pressure
Can expect 3 to 8% Downside for Monthly Time frame


buy titantitan has given ichimoku breakout. it has closed abv cloud and also lagging span has losed abv cloud. we may see more upside


TITANMonthly pattern breakout.
Retrace done.
Price should take support & move-up to the next target.

TITAN getting ready for breakout !TITAN in the process of completing full cycle and getting ready for the breakout !


