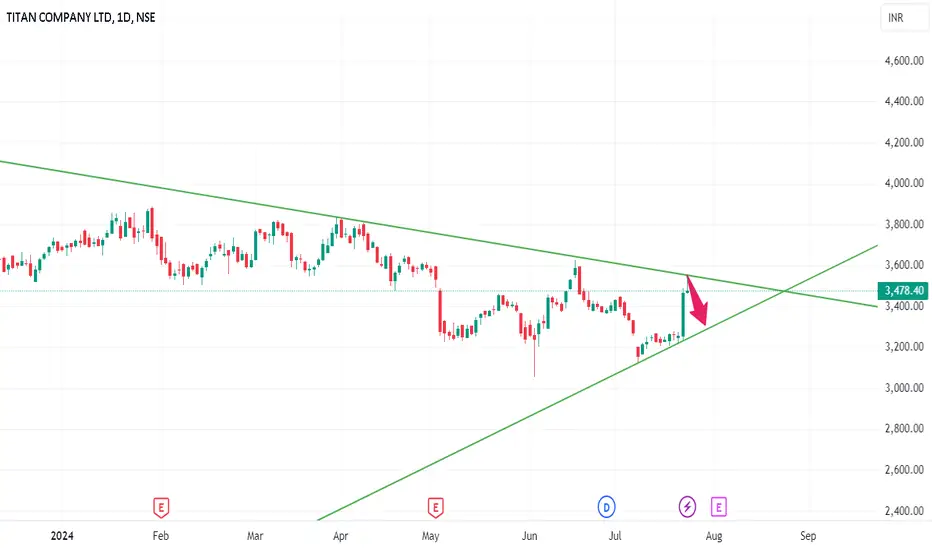
Titan - long term secular storyStock price made a double top pattern and took support near double top neckline and an upward trend line. If this support sustains then high chances that stock could do some consolidation and come back to previous highs, otherwise 2600-2700 levels are possible where stock price should settle down. Long term secular story hence keep on radar.
TITAN trade ideas

Titan Company Ltd. Technical AnalysisTitan has been trading within a consolidation phase recently, suggesting that buyers and sellers are in balance. Let’s look deeper at the technical levels and indicators that might guide us in the coming sessions:
1. Support and Resistance Zones:
Key Resistance Levels: The immediate resistance sits around ₹3,452.50 and further up at ₹3,557.05. These levels could act as barriers if the stock attempts a breakout from current levels.
Key Support Levels: Titan has notable support at ₹3,233.95. A drop below this could signal further downside pressure.
2. Trendline Analysis:
A descending trendline has been in place, connecting recent lower highs. If Titan breaks above this trendline with sustained volume, it could indicate a potential bullish reversal.
Meanwhile, a smaller, rising support line (forming a wedge pattern) offers a bullish signal if the price manages to hold above it in the short term.
3. MACD Indicator:
The MACD is currently in negative territory, indicating that the stock is under some bearish momentum. However, if we see a crossover above the signal line soon, it could hint at a possible bullish shift.
3. Volume Insights:
Volume has remained relatively stable, showing no major spikes that would suggest a strong trend continuation or reversal. A rise in volume, especially near support or resistance levels, may validate any potential breakout or breakdown.
Conclusion: Titan appears to be in a consolidation phase, with the possibility of a breakout in either direction. Traders might look for confirmation at key levels, such as a break above the ₹3,452.50 resistance for bullish momentum or a fall below ₹3,233.95 support for bearish sentiment. Monitoring the MACD signal line crossover and volume trends will be crucial to anticipate the next movement.

TITAN S/RSupport and Resistance Levels:
Support Levels: These are price points (green line/shade) where a downward trend may be halted due to a concentration of buying interest. Imagine them as a safety net where buyers step in, preventing further decline.
Resistance Levels: Conversely, resistance levels (red line/shade) are where upward trends might stall due to increased selling interest. They act like a ceiling where sellers come in to push prices down.
Breakouts:
Bullish Breakout: When the price moves above resistance, it often indicates strong buying interest and the potential for a continued uptrend. Traders may view this as a signal to buy or hold.
Bearish Breakout: When the price falls below support, it can signal strong selling interest and the potential for a continued downtrend. Traders might see this as a cue to sell or avoid buying.
20 EMA (Exponential Moving Average):
Above 20 EMA: If the stock price is above the 20 EMA, it suggests a potential uptrend or bullish momentum.
Below 20 EMA: If the stock price is below the 20 EMA, it indicates a potential downtrend or bearish momentum.
Trendline: A trendline is a straight line drawn on a chart to represent the general direction of a data point set.
Uptrend Line: Drawn by connecting the lows in an upward trend. Indicates that the price is moving higher over time. Acts as a support level, where prices tend to bounce upward.
Downtrend Line: Drawn by connecting the highs in a downward trend. Indicates that the price is moving lower over time. It acts as a resistance level, where prices tend to drop.
RSI: RSI readings greater than the 70 level are overbought territory, and RSI readings lower than the 30 level are considered oversold territory.
Combining RSI with Support and Resistance:
Support Level: This is a price level where a stock tends to find buying interest, preventing it from falling further. If RSI is showing an oversold condition (below 30) and the price is near or at a strong support level, it could be a good buy signal.
Resistance Level: This is a price level where a stock tends to find selling interest, preventing it from rising further. If RSI is showing an overbought condition (above 70) and the price is near or at a strong resistance level, it could be a signal to sell or short the asset.
Disclaimer:
I am not a SEBI registered. The information provided here is for learning purposes only and should not be interpreted as financial advice. Consider the broader market context and consult with a qualified financial advisor before making investment decisions.

Titan :- Swing TradeLesson-1
Strategy Name- Super Trend Strategy
Scan:- Price cross above super trend (weekly & Daily). RSI is greater than 60 (Weekly).
Logic:-
When the weekly super trend turns to buy and RSI is above 60, stock is likely to be in trend. Its best to enter at retracement, however stop loss to be kept at the super trend level (close).
Sometimes its too big stop loss, so enter with low quantity. But when i did back test, if the reversal is from the bottom, then this trend last for years. But in this case, TITAN is already trading at the top. So after you enter, keep stop loss.
Target:
As per Fibb Retracement in the Chart.


TITAN READY SHINING AGAIN... NSE:TITAN trade at 3680 level. you can watch for an upside move at 4200-4300.

Titan has formed a trendline breakoutTitan NSE:TITAN has formed a trendline breakout. Wave 3 is getting formed and you can buy above 3625 and Target would be 3960. This is a Very short target as Wave has already gine 1.618% and so we shoud expect only 1.00%

TITAN buy side bullish flagBullish flag formed in titan. even though target adjusted from reversal point. Target need to be adjusted according to reversal point in bullish/bearish flag.

TITAN broke out of long term resistanceTITAN formed broadening wedge pattern on daily chart. Price broke out of resistance line today with strong bullishness. Entering at this level offers ideal risk reward of 1:5. I really like when risk is low like this one. Always I try to keep the risk at less than 5%. One can move the target as price moves in favour. Stop loss can be held just below previous swing low which is not far away.
Hope you like this idea. If so, please boost this idea or leave a comment below on what you think. Otherwise, happy trading :-).

Titan _ Parabolic_LongNSE:TITAN Weekly chart showing parabolic moves possible in near term. Macd showing positive momentum exactly from weekly location.

TITAN 1WThat's interesting! Seasonal patterns can be significant in trading. Have you noticed any specific reasons for the price increase in August, like market trends or events?
let's see what happens...
I Am Not SEBI Registered Analyst. All Post and Levels Posting is only for educational and knowledge purpose. I Am not responsible for your any kind of loss or profit.
No Claim, All Rights Reserved.‼️

Plan for 5th August 2024Nifty future and banknifty future analysis and intraday plan in kannada.
STOCKS TO WATCH.
This video is for information/education purpose only. you are 100% responsible for any actions you take by reading/viewing this post.
please consult your financial advisor before taking any action.
----Vinaykumar hiremath, CMT


Titan may see a major declineA major decline may be seen in Titan. This stock was going up strongly in the past few days, but in today's session it may see a big decline. Please seek the help of your financial advisor before making any investment.
Titan Upside Breakout LevelsHi,
As per my analysis, here are NSE:TITAN upside breakout levels. Trend is still bullish.
Note: This is my personal analysis, only to learn stock market behavior. Kindly do your own analysis/research to take any trade.
Thanks

TITANA fundamentally very strong stock available in stock also buying happening with big elephant candle on daily time frame. Volumes are also very high.
200 MA on daily time may work as a hurdle see the price action in coming days if this stock makes consolidation on this price range it will be gud buy with the very low sl
SL 3200
First target - All time high
it has gud potential for upside . Follow strict SL & Proper RISK REWARD RATIO. This is the only holy grail in the market.

TITAN LONG POSITIONHi traders,
Let´s take a look at TITAN on 1W time frame. It looks like the price has been in the bullish macro trend. The key support line has been retested and we got the bounces however we are expecting one more retest before going higher. Entry price, stop loss and target price are shown on the chart .


TITAN - 3000 or 3500+ in July ??- Currently Titan is at consolidation phase if its break 3456 level then bulls might be back in game and the upside target will be around 3580.
- However if the stock breaks the support level which is around 3370 then the bears will be back and the downside target will be around 3230.
-In Daily TF its forming lower highs and a Descending triangle.
*Trade smartly these are all my personal views and not any buying or selling recommendations*

TITAN looks to bearish for short termThe Price going up but volume are reducing...the fall in titan is expecting let us see ...good buy will be at 2700-3000 range.

Titan Long Trade SetupTitan is bullish on Weekly Time Frame and coming from Daily supply zone
but It's Showing Strength @125m demand zone
so we can expect reversal here
keep On watch


Titan: Turned Bullish TGT 3800+Titan came out of its bad phase.
Earlier Resistance is now a Support.
RSI walked past 60 on Daily Chart
Buy on Intraday Dips (Use Camerilla Pivots for longer range)
Quite possible it march past Previous Highs
