Tamilnad Merca Bank trying to rise with volumes.Tamilnad Mercantile Bank Ltd. engages in the provision of banking services. It offers loan products, current accounts, business and prepaid cards, online and foreign exchange services. It operates through the following business segments: Treasury, Corporate/Wholesale Banking, and Retail Banking.
T
75.80 INR
11.83 B INR
61.35 B INR
113.05 M
About TAMILNAD MERCA BANK LTD
Sector
Industry
CEO
Salee Sukumaran Nair
Website
Headquarters
Thoothukudi
Founded
1921
ISIN
INE668A01016
FIGI
BBG012DZQNL0
Tamilnad Mercantile Bank Ltd. engages in the provision of banking services. It offers loan products, current accounts, business and prepaid cards, online and foreign exchange services. It operates through the following business segments: Treasury, Corporate/Wholesale Banking, and Retail Banking. The company was founded in 1921 and is headquartered in Thoothukudi, India.
Related stocks
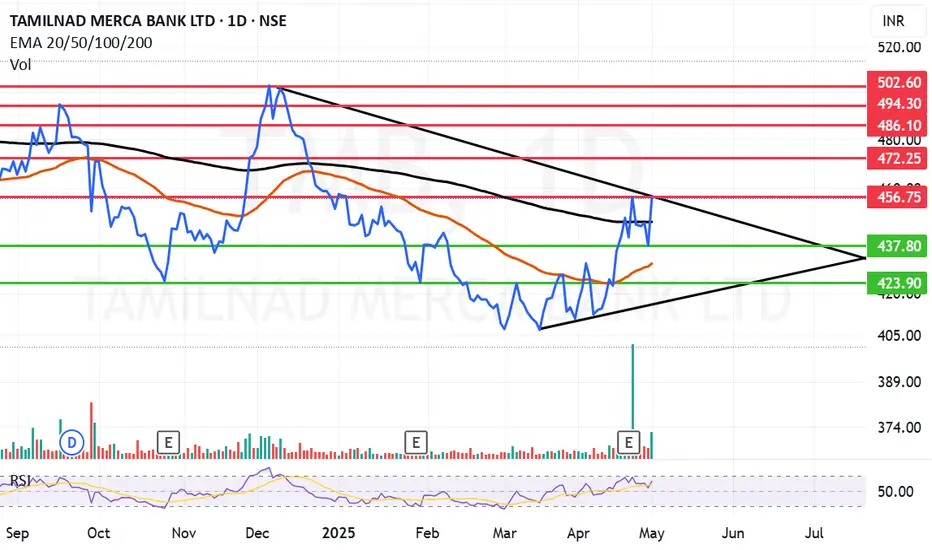
TMB Trading Above Fresh Demand ZoneTMB is currently trading at ₹456.85, above its fresh demand zone between ₹450.55 and ₹442.55, established on 27th November 2024. This untested zone reflects potential buying interest, and investors may monitor for signs of price action near this level to evaluate trading opportunities.
Disclaimer:

Price Can see Big Move On TMB.Price Can see Big Move On TMB as price is getting rejected at demand, Make sure trend line break with volume.

TMBwe are looking TMB bullish move.
Disclaimer:
Kind regards to all friends and members ,
Stock market investment is subject to 100% market risks. Our company is not a SEBI registered company. Please consult your financial advisor before investing. This is for learning and training purposes only. Mar

TMB (Tamilnadu merca bank) right to enter for swing ??no, this is not right time to enter swing . as per my anlysis ,choch happened, after choch it need to colloect poi. my entry at 455 and sl at 424 and my target at 796..
all my analysis for educational purpose only

Within a week - 20% Possible Reversal -20% is possible.
Note : I am not SEBI registered and all Ideas posted by me are for Educational Purpose.
Good luck!
Thanks & Regards,
RK

TMB a casual postI came across this script as it was tempting me to analyze, find the possible entry. But, When I actually viewed this script chart on trading view in conventional red and green type, I was astonished to see the quantum of red vs green candles.
This does not change my view or analysis as such for th

TMB TRIANGLE PATTERN SWING TRADEswing trade take trade when nifty turns bullish swing trade perfect symmetrical triangle short term opportunity for upside take trade after breakout from the trendline according to own risk this is not call just a analysis.

TMB - Weekly AnalysisIn the Weekly Chart of TMB ,
we can see that, it has created a Bullish hammer candle.
2 possible momentum has been shown in chart.


See all ideas
Summarizing what the indicators are suggesting.
Oscillators
Neutral
SellBuy
Strong sellStrong buy
Strong sellSellNeutralBuyStrong buy
Oscillators
Neutral
SellBuy
Strong sellStrong buy
Strong sellSellNeutralBuyStrong buy
Summary
Neutral
SellBuy
Strong sellStrong buy
Strong sellSellNeutralBuyStrong buy
Summary
Neutral
SellBuy
Strong sellStrong buy
Strong sellSellNeutralBuyStrong buy
Summary
Neutral
SellBuy
Strong sellStrong buy
Strong sellSellNeutralBuyStrong buy
Moving Averages
Neutral
SellBuy
Strong sellStrong buy
Strong sellSellNeutralBuyStrong buy
Moving Averages
Neutral
SellBuy
Strong sellStrong buy
Strong sellSellNeutralBuyStrong buy
Displays a symbol's price movements over previous years to identify recurring trends.
Frequently Asked Questions
The current price of TMB is 429.50 INR — it has decreased by −0.39% in the past 24 hours. Watch TAMILNAD MERCA BANK LTD stock price performance more closely on the chart.
Depending on the exchange, the stock ticker may vary. For instance, on NSE exchange TAMILNAD MERCA BANK LTD stocks are traded under the ticker TMB.
TMB stock has fallen by −3.48% compared to the previous week, the month change is a −5.07% fall, over the last year TAMILNAD MERCA BANK LTD has showed a −5.82% decrease.
TMB stock is 1.17% volatile and has beta coefficient of 0.45. Track TAMILNAD MERCA BANK LTD stock price on the chart and check out the list of the most volatile stocks — is TAMILNAD MERCA BANK LTD there?
Today TAMILNAD MERCA BANK LTD has the market capitalization of 67.96 B, it has decreased by −2.59% over the last week.
Yes, you can track TAMILNAD MERCA BANK LTD financials in yearly and quarterly reports right on TradingView.
TMB net income for the last quarter is 3.05 B INR, while the quarter before that showed 2.92 B INR of net income which accounts for 4.45% change. Track more TAMILNAD MERCA BANK LTD financial stats to get the full picture.
Yes, TMB dividends are paid annually. The last dividend per share was 11.00 INR. As of today, Dividend Yield (TTM)% is 2.33%. Tracking TAMILNAD MERCA BANK LTD dividends might help you take more informed decisions.
TAMILNAD MERCA BANK LTD dividend yield was 2.68% in 2024, and payout ratio reached 14.73%. The year before the numbers were 2.06% and 14.77% correspondingly. See high-dividend stocks and find more opportunities for your portfolio.
As of Aug 9, 2025, the company has 4.74 K employees. See our rating of the largest employees — is TAMILNAD MERCA BANK LTD on this list?
Like other stocks, TMB shares are traded on stock exchanges, e.g. Nasdaq, Nyse, Euronext, and the easiest way to buy them is through an online stock broker. To do this, you need to open an account and follow a broker's procedures, then start trading. You can trade TAMILNAD MERCA BANK LTD stock right from TradingView charts — choose your broker and connect to your account.
Investing in stocks requires a comprehensive research: you should carefully study all the available data, e.g. company's financials, related news, and its technical analysis. So TAMILNAD MERCA BANK LTD technincal analysis shows the sell today, and its 1 week rating is strong sell. Since market conditions are prone to changes, it's worth looking a bit further into the future — according to the 1 month rating TAMILNAD MERCA BANK LTD stock shows the strong sell signal. See more of TAMILNAD MERCA BANK LTD technicals for a more comprehensive analysis.
If you're still not sure, try looking for inspiration in our curated watchlists.
If you're still not sure, try looking for inspiration in our curated watchlists.